

This free Claude skill reads your deal export, finds the stage that’s costing you the most revenue, and shows you how much fixing it could be worth.
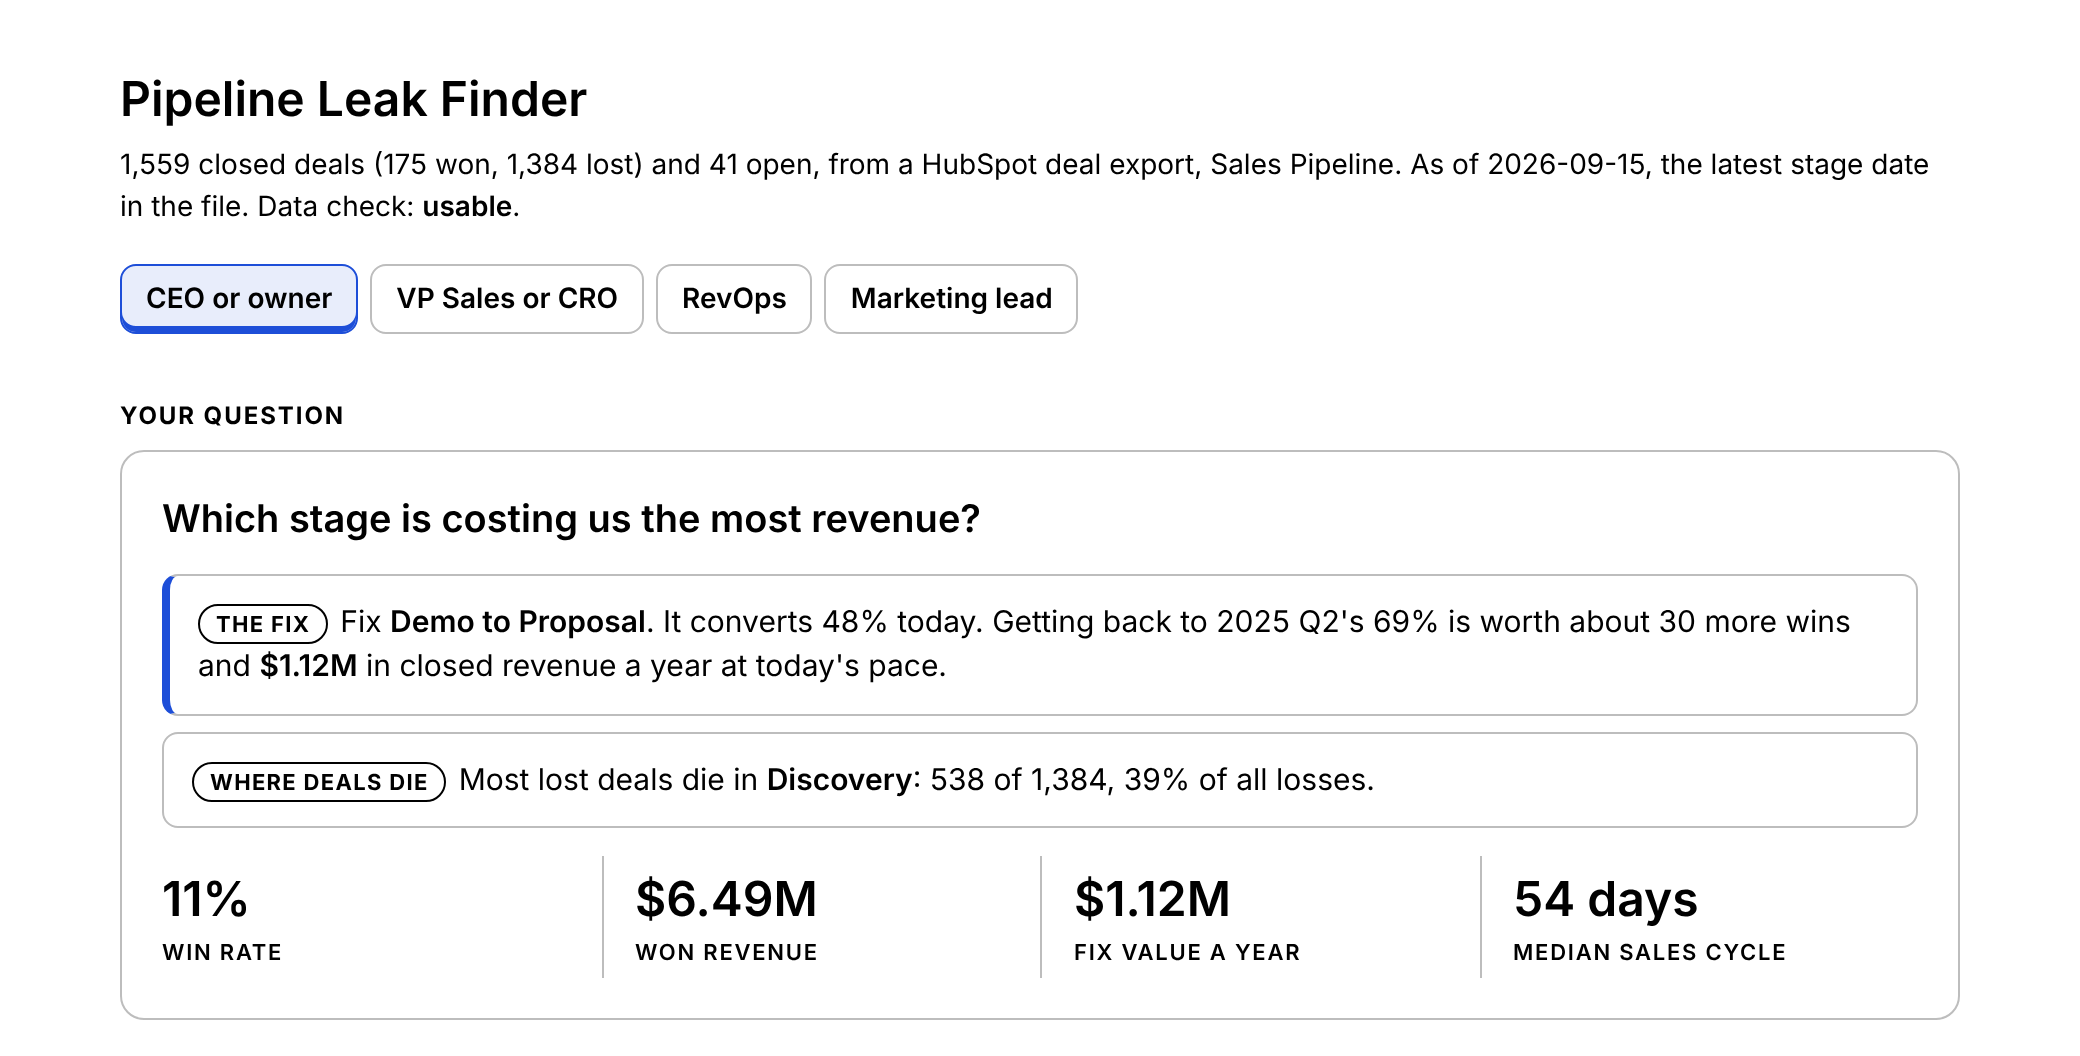
How much money are you leaving on the table? Your funnel metrics hold a lot of useful information. Finding those insights is the difference between a great quarter, an average one, or a bad one.
This month’s skill reads your pipeline, finds the leaks, and puts a dollar figure on fixing each one. It’s free, runs inside Claude, and your data stays in your session.
What is the problem?
A win rate is just one number for a five-step process. It tells you how many deals you’ve lost, but not where or why they dropped out. The pipeline keeps leaking and deals keep slipping away.
The cracks appear in three places.
Win rate can be misleading. Behind an 11% win rate sits a weak demo, an ignored proposal, or big deals stuck in legal. Each situation needs a different fix and a different owner.
The busiest stage isn’t always the most costly. For example, losing the most deals in the first stage is normal and cheap. Leadership might say, “flood the funnel!” but that can hurt your LTV:CAC ratio.
Time alone can kill or save your pipeline. If deals stall in a stage for weeks, they often end up marked as “lost.” Your CRM can show you that time was the silent killer.
Losing a deal after a demo and proposal costs much more, while saving one at the end is a big win. In the sample, fixing Demo to Proposal is worth more than fixing any other stage.
What does a leaky funnel cost?
There are three common ways pipeline leaks cost you money.
First, you fix the wrong stage. Pushing more deals into a leaky stage just means more losses and higher acquisition costs.
Second, stalled deals die quietly. In the sample file, proposals that moved within 17 days won 66% of the time, but those that sat past day 17 only won 30%. No one flagged them while they were still active.
Third, the debate goes in circles. Without a trusted stage-level number, sales and marketing keep arguing about lead quality every quarter, and the issue just gets pushed aside again.
What does the skill do?
You upload a deal export with stage history from HubSpot, Salesforce, or any CRM. Claude gives you:
Conversion from each stage to the next
Time in each stage, and the day a deal counts as stalled
Where lost deals die, by count and by value
Every stage ranked by the closed revenue a fix is worth
The open deals stuck right now
Then it builds an interactive tool you can open in your browser.
A script handles all the math, so the same file always gives the same answer. Claude simply reports what the script finds. It never guesses or makes up numbers.
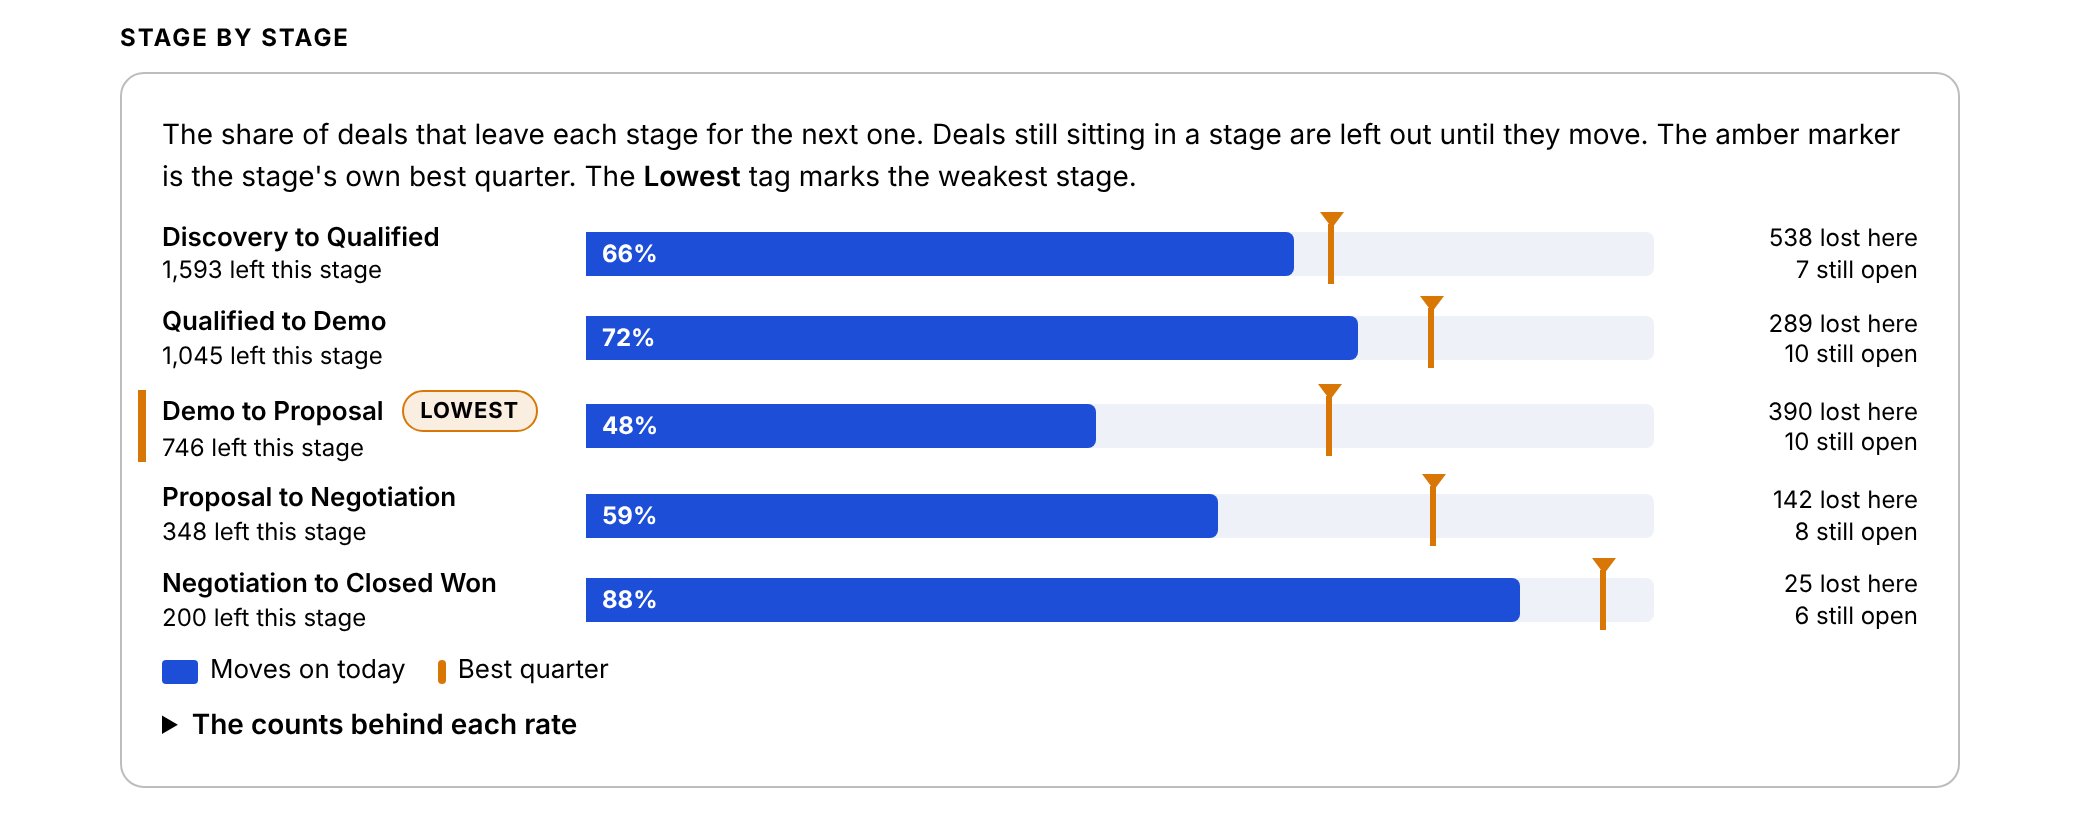
Here’s the stage-by-stage view from the sample file included with the skill. The amber marker shows each stage’s best quarter.
Who is it for?
Four seats, because each one reads a pipeline differently. Tell Claude your seat. The analysis stays the same. The answer is built for you.
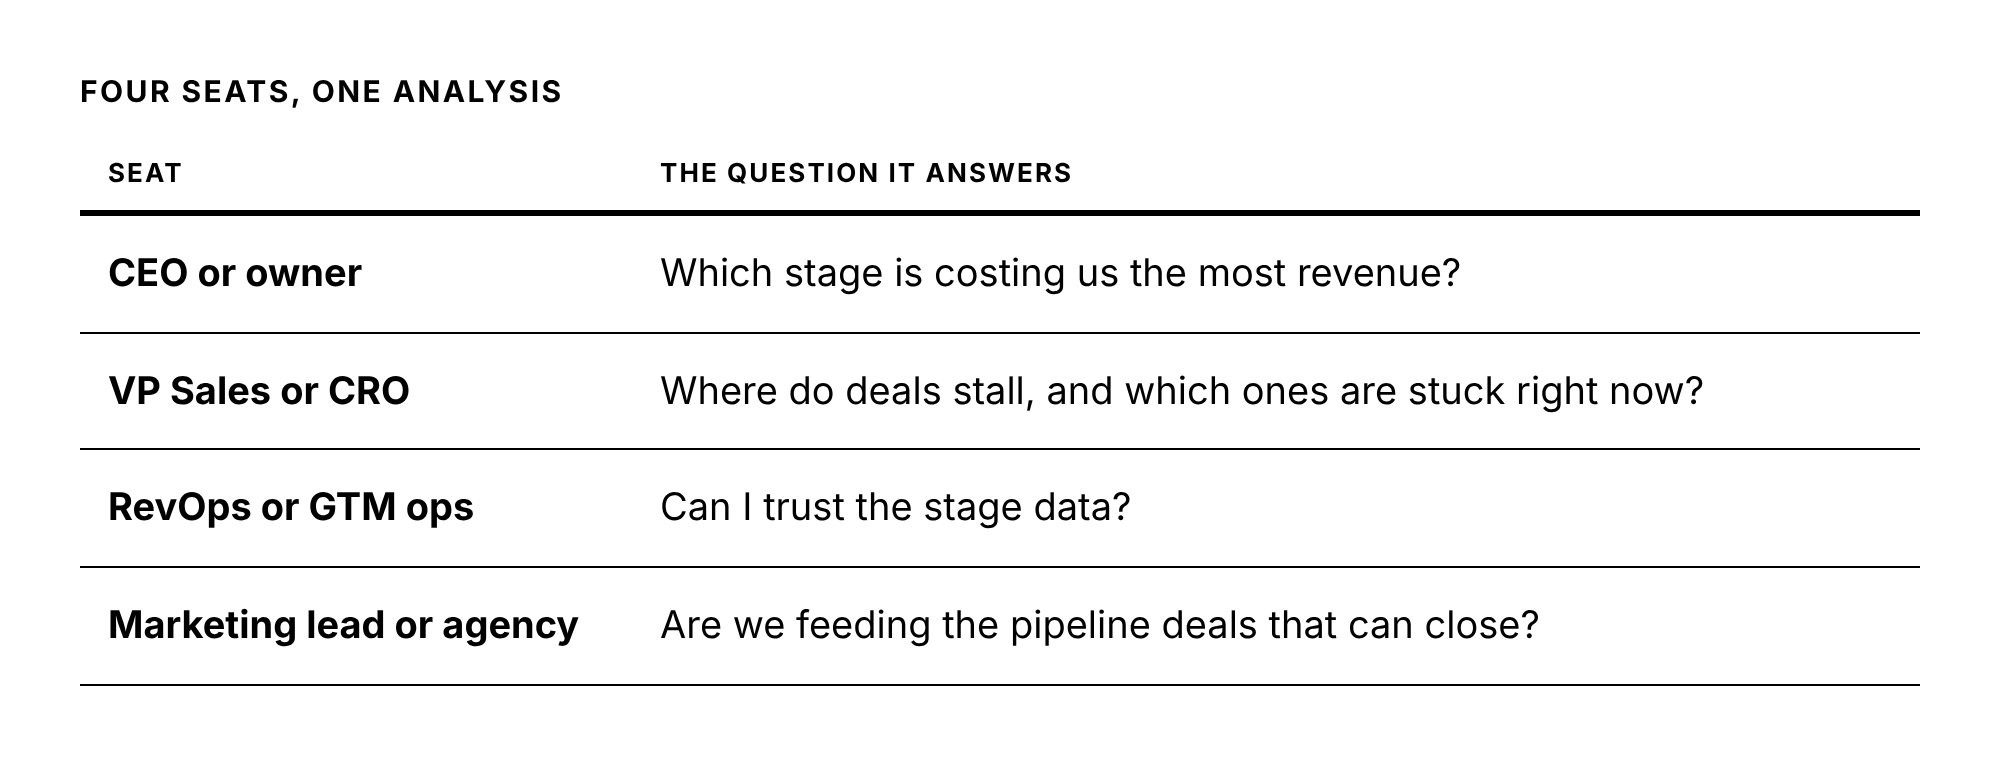
The CEO gets one stage to fix and what it is worth. The CRO gets the stall lines and the list of deals stuck today. RevOps gets a verdict on the stage data and a ranked fix list. Marketing gets the early losses, so it can see whether the deals it sends survive the first stages.
How does it value a fix?
Against your own best quarter. Never an industry benchmark.
A benchmark comes from companies you know nothing about. Your best quarter is a rate this team, with this product, in this market, already hit.
For each stage, the skill finds the quarter it converted best. Then it values the gap:
Deals through the stage last year × the gap to the best quarter × the share of those deals that go on to win × your average won deal.
The answer is closed revenue a year if the stage hit that rate again.
In the sample, Demo to Proposal converts 48%. In 2025 Q2 it hit 69%. Getting back there is worth about 30 more wins and $1.12M in closed revenue a year at today’s pace.
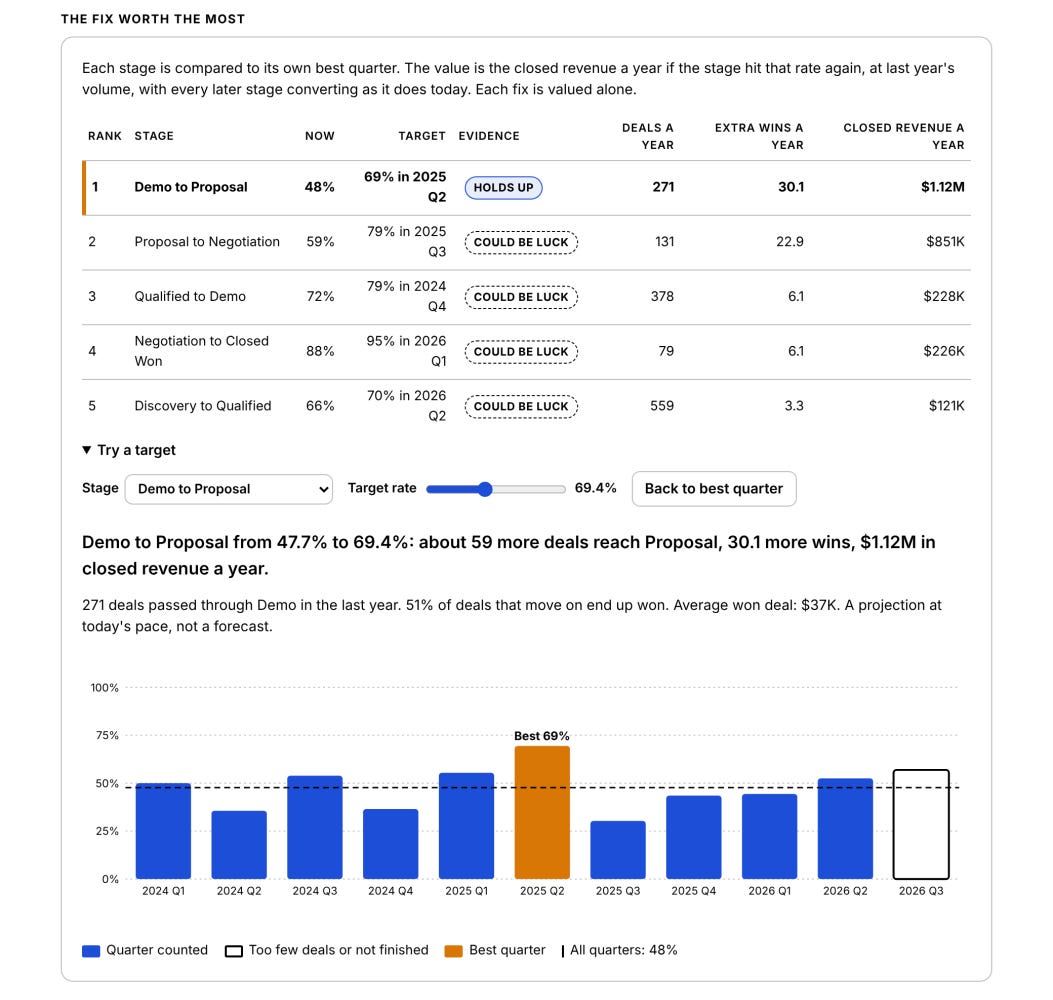
Drag the target in the tool and the extra wins and revenue update. The stage’s rate by quarter sits underneath, so you can see the best quarter against all the others.
How do I know the best quarter was real?
The skill tests it. Pick the best of ten quarters and one will look good by chance. So every best quarter is tested against all the others before it becomes a target.
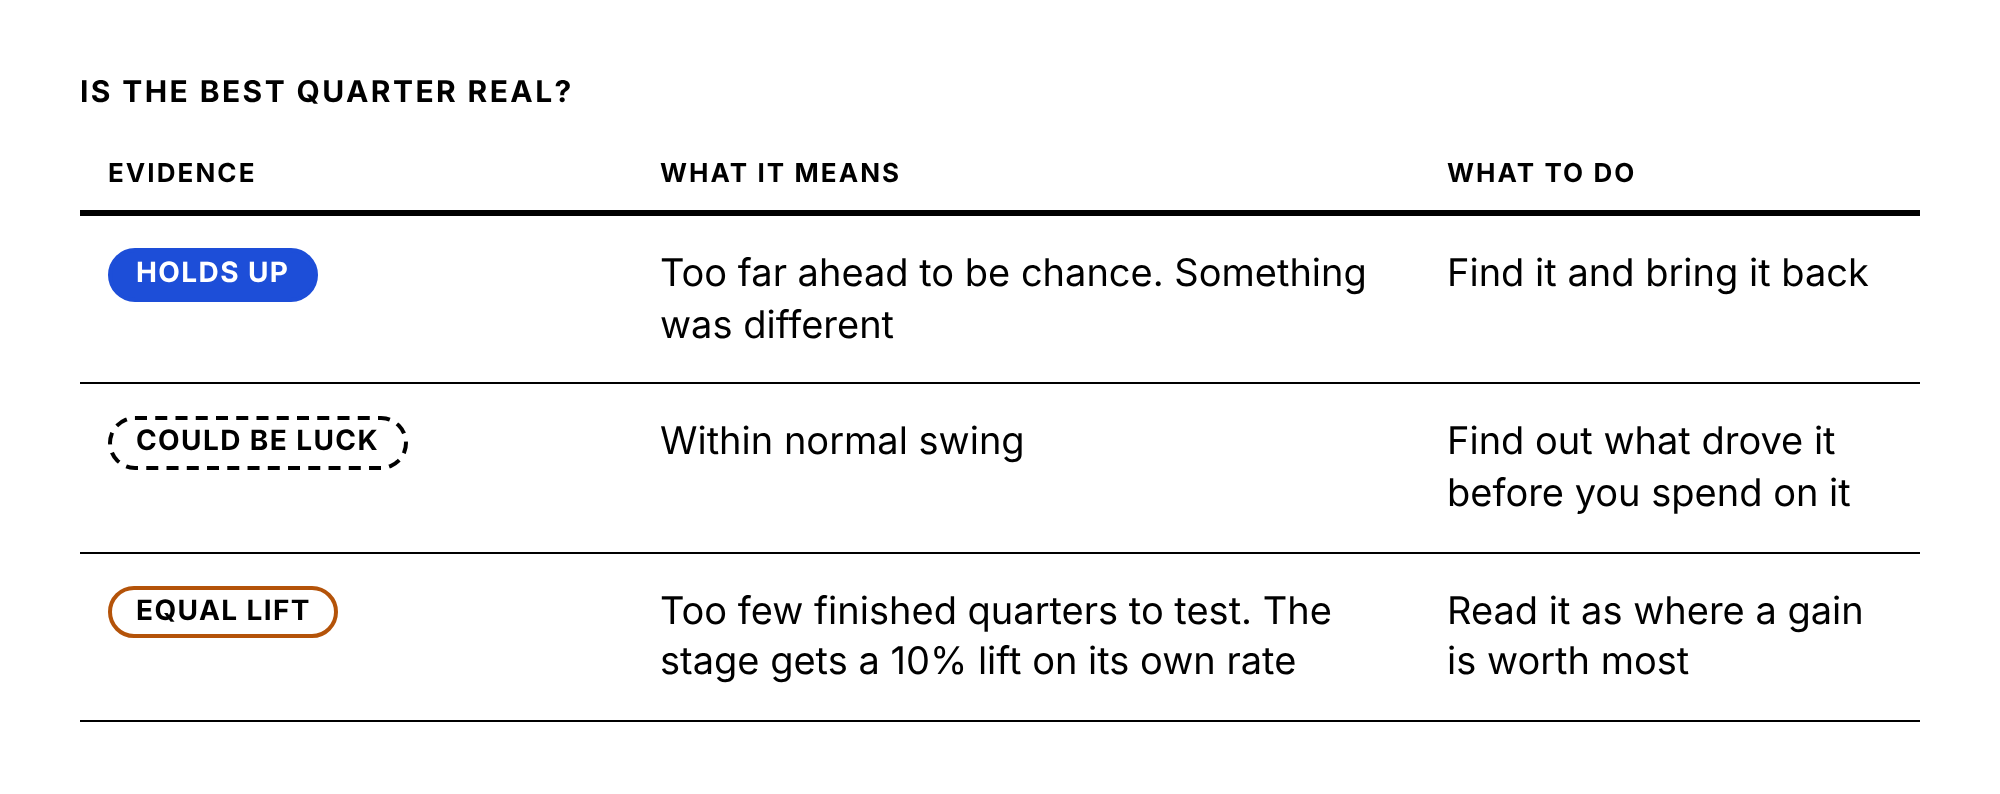
The Demo quarter holds up. Something was different in 2025 Q2, and the job is to find it and bring it back.
Proposal to Negotiation shows a 20-point gap too, worth $851K on paper. Its best quarter could be luck. The skill says so, and it never puts a lucky quarter at the top without saying it.
Where do lost deals die?
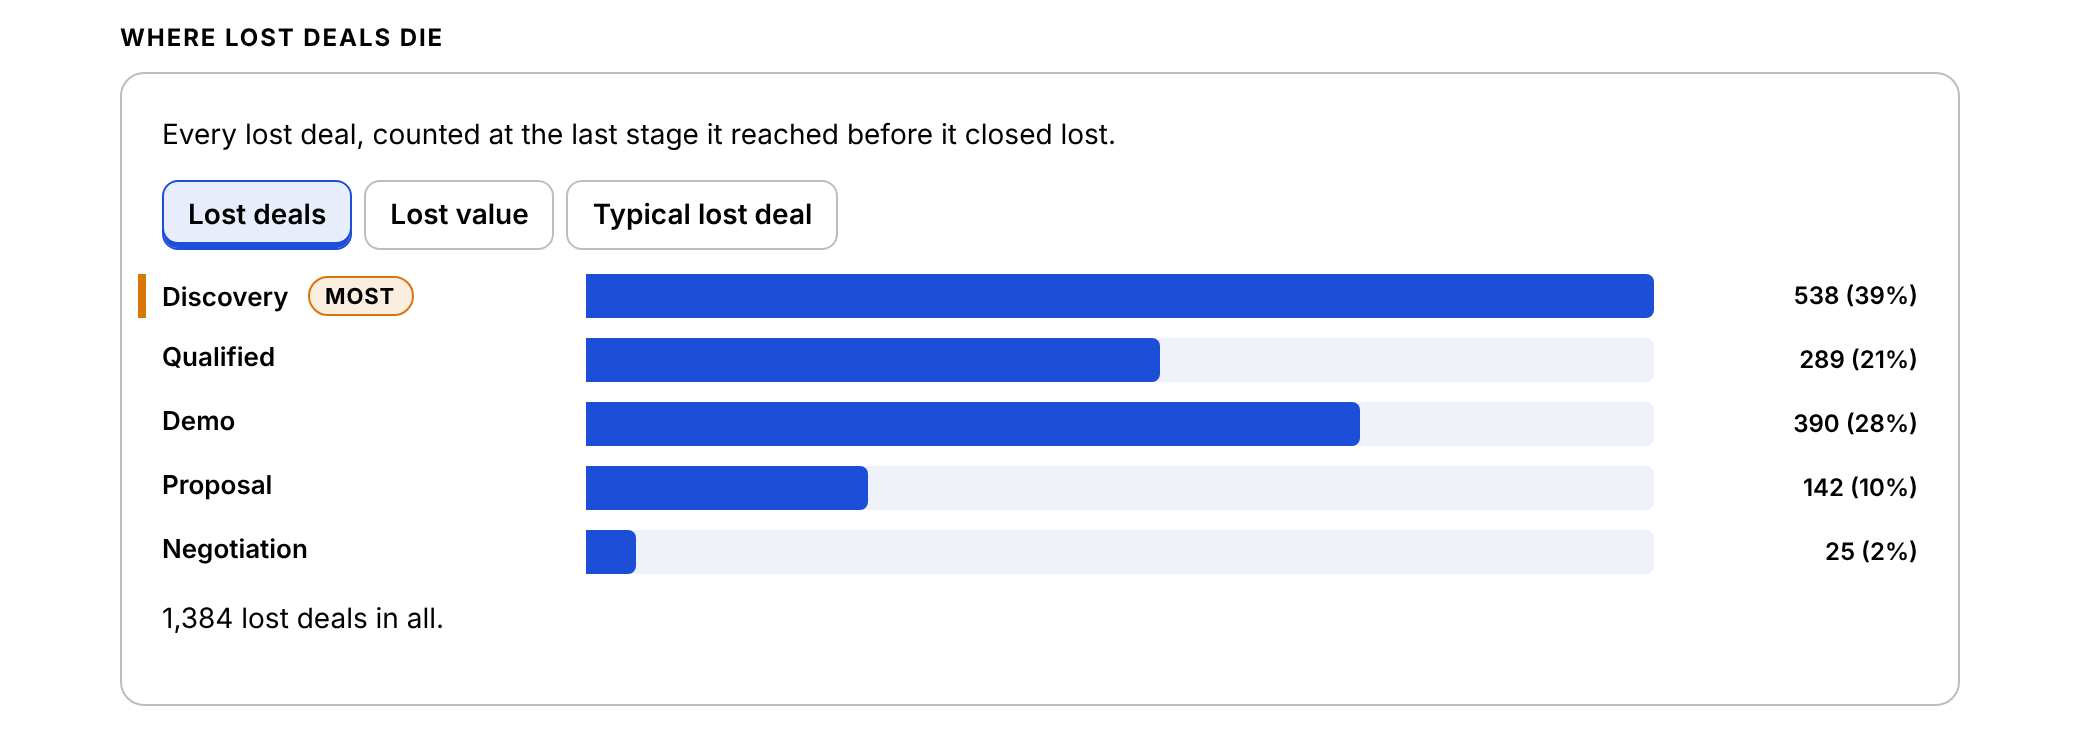
Every lost deal is counted once, at the last stage it reached. In the sample, 39% of lost deals die in Discovery: 538 of 1,384.
That is the biggest pile, and it is not the biggest leak. Early losses are cheap. The skill shows lost deals by count, by value and by typical deal size, so you can tell a stage that loses many small deals from a stage that loses a few big ones. In the sample, the typical deal lost in Negotiation is $58K, nearly twice the size of deals lost in any other stage.
Does waiting cost deals?
The skill draws a stall line for every stage: the day by which three in four deals that moved on had already left. It comes from your data, not a rule of thumb.
Then it compares the final win rate of deals that left in time against deals that sat past the line. In the sample, Proposal is the costly wait. Proposals that left within 17 days won 66%. Proposals that sat past day 17 won 30%.
Read that as a warning sign, not a cause. A slow deal is often slow because the buyer was never serious, and rushing it will not make them serious. The useful move: the stall line is the day a manager asks what the next step is.
Which deals are stuck right now?
Every open deal past its stage’s stall line, biggest first. In the sample, 3 deals worth $160K.
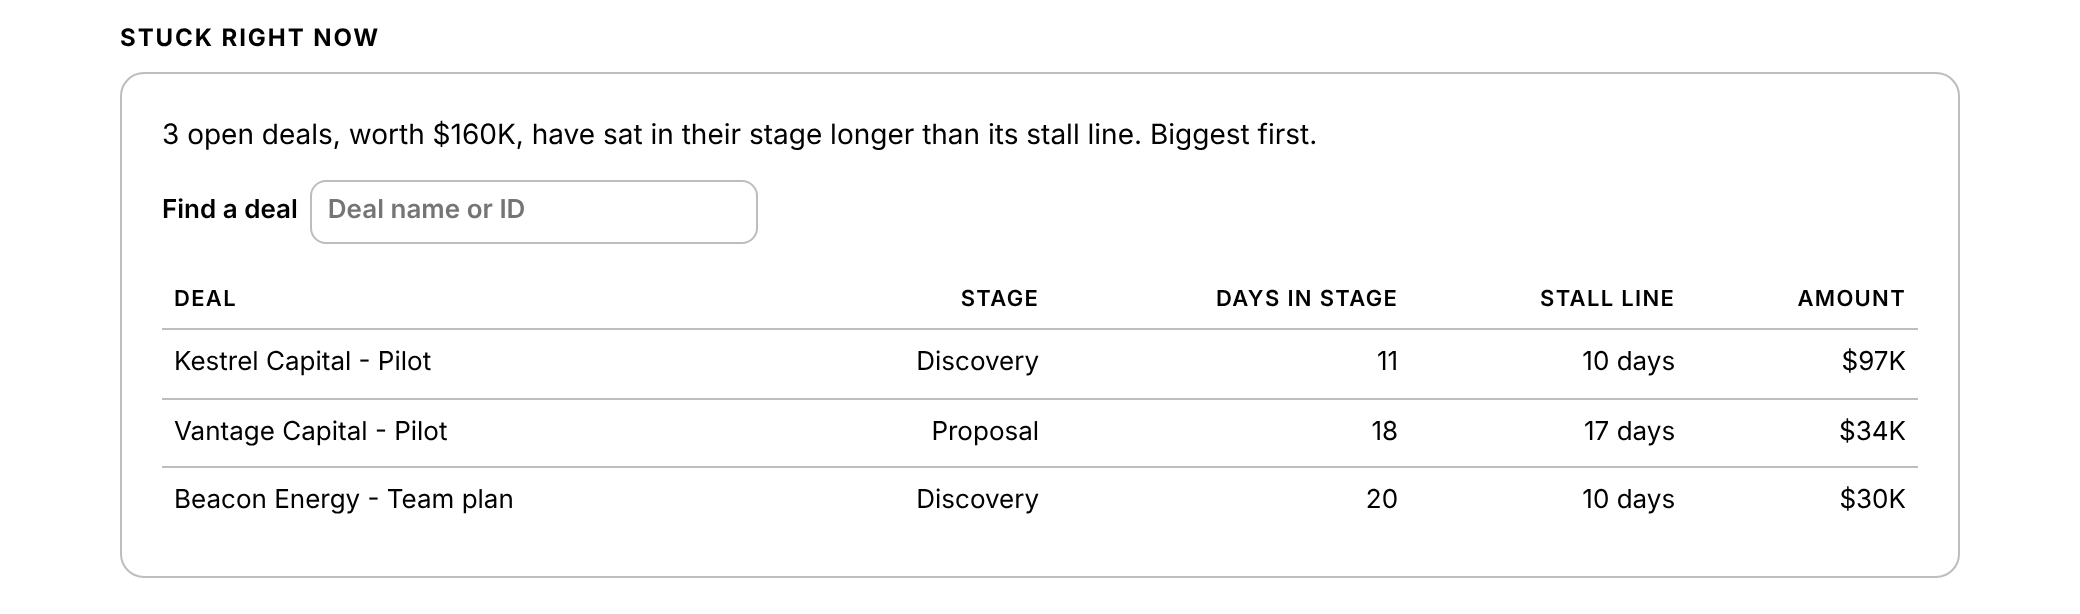
That list is the one part of the readout a sales leader can act on this afternoon. Each deal gets a next step this week or gets closed out.
What does it check before it answers?
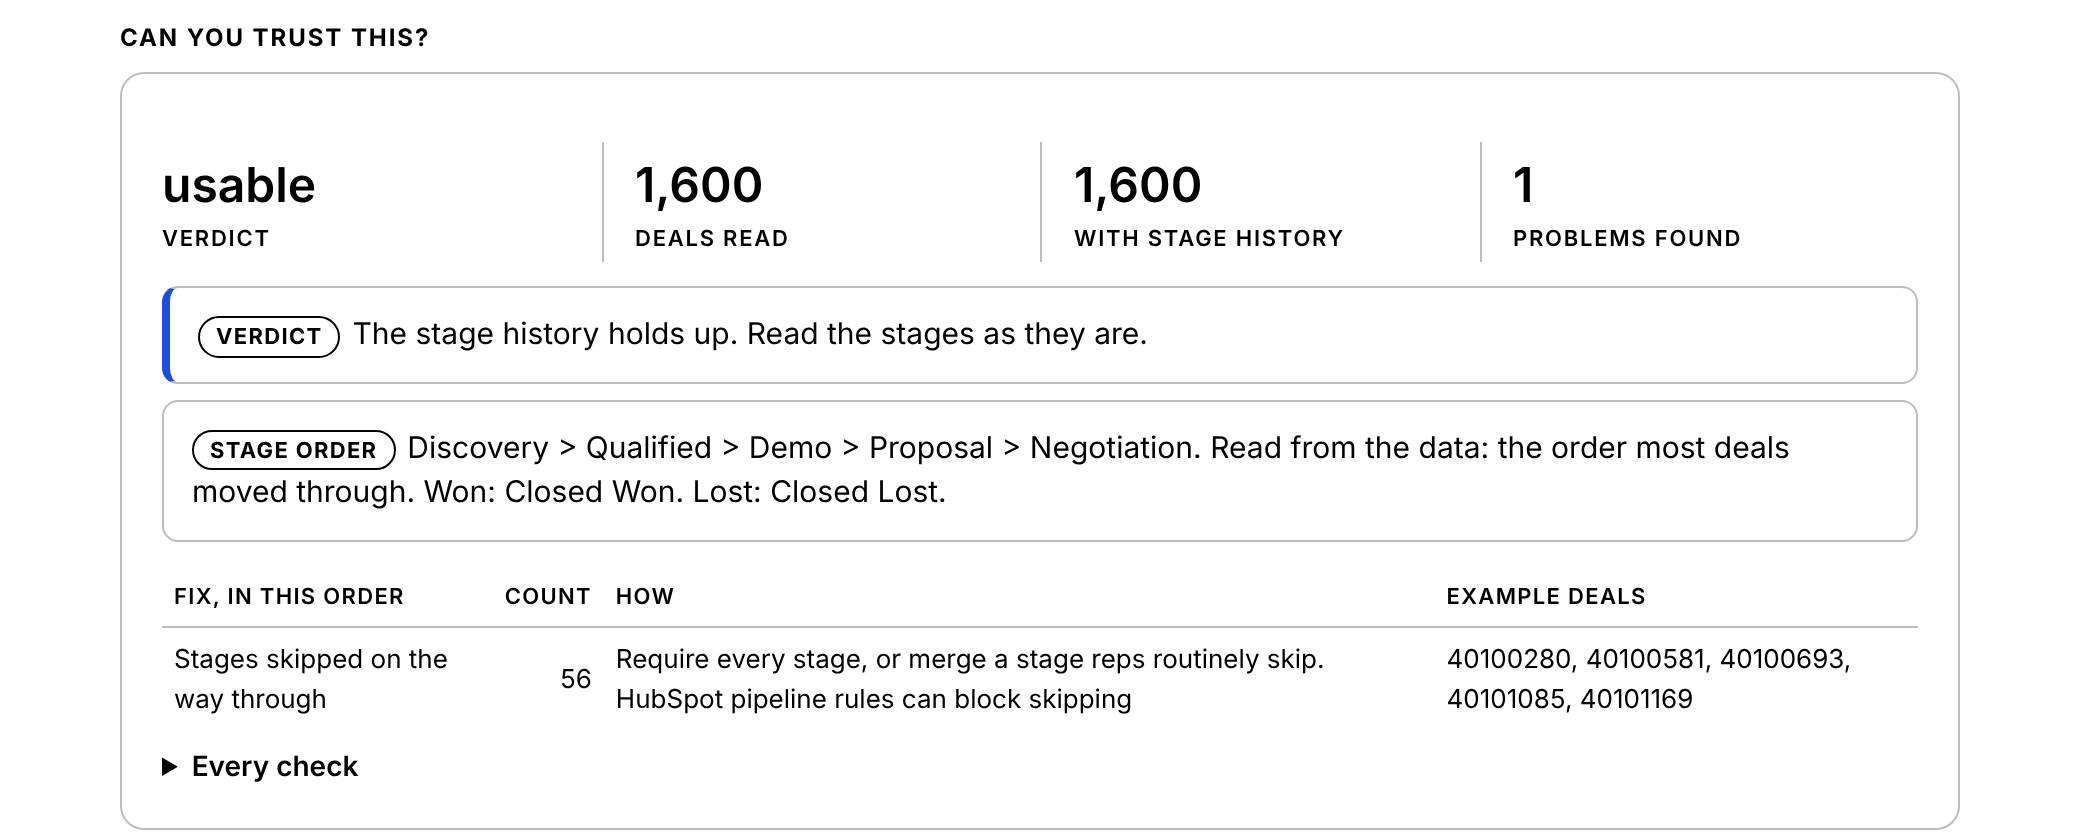
Whether your stage history can be trusted. Before any answer, the skill counts every problem in the file: rows exported twice, deals from other pipelines, closed deals with no stage history, stage dates out of order, skipped stages, amounts saved as text, and mixed or unreadable dates.
Then it gives a verdict: usable, usable with caveats, or not usable. If the stage history cannot be trusted, that becomes the headline for every seat, and no fix value appears.
It does not fill gaps. A rate behind fewer than 20 deals shows as a count, like “12 of 17,” never a percentage. Fix values are each valued alone and never added together.
How was it tested?
On six test files, including one HubSpot file broken on purpose with ten planted data problems: duplicate rows, a second pipeline, wiped stage dates, amounts typed as “45.3k,” close dates in 2031 and “TBD.” The skill caught every one and returned “usable with caveats.”
Every count, rate, stall line and fix value was recomputed from the source records with separate code and matched exactly. The sample ships as both a HubSpot export and a Salesforce history report, and both give identical answers. On a smaller 600-deal file, the skill found the same leak and refused to call it proven, because the evidence was not there yet.
What will it not do?
Tell you why a deal was lost. It shows where, not why
Promise a fix value. It is a projection at today’s pace, not a forecast
Call a lucky quarter a real one
Add fix values together
Compare you to other companies
What do I need before I run it?
The skill reads the path each deal took through your pipeline. If your CRM never recorded when a deal changed stage, no analysis can recover it.
To run it at all
Any Claude plan, Free included, with code execution turned on
A deal export with stage dates, not just the current stage. In HubSpot, the “Date entered” column for every stage. In Salesforce, the Opportunity History report
Won, lost and open deals from the last 12 to 24 months
At least 40 closed deals with stage history, 10 won and 10 lost. 150 or more is where stage rates get steady
Amount on won deals
To trust the answer
Stage history turned on for the whole period
Reps move deals when they move, not in a Friday afternoon batch
Lost deals marked lost, not deleted
Every stage used, not routinely skipped
Stages unchanged during the period. If you renamed or split one, export only the period after the change
Renewals in their own pipeline
No connectors, no integrations, no API keys. It works from the file you upload.
How do I get it?
Download the skill from GitHub: github.com/bbecht/demand-gen-claude-skills
In Claude, go to Customize > Skills > + > Create skill > Upload a skill
Turn on code execution
Export your deals with stage history and upload the CSV
Tell Claude your seat: “Where are we losing deals? I’m the CEO.”
No export handy? The repo ships the sample as a HubSpot export and a Salesforce history report. 1,600 invented deals with real leaks planted in them. Run it and see if the skill finds them.
What does this unlock?
One stage to fix first, a dollar figure for fixing it, and a list of deals to save this week.
For the CEO, the pipeline conversation moves from “our win rate is low” to “Demo to Proposal is worth $1.12M a year, and we already hit the target once.” For sales, stalled deals surface while there is still time. For RevOps, a verdict on the stage data and a fix list. For marketing, proof of whether the deals it sends survive the first stages.
It also turns blame into a task. “Sales can’t close” is a complaint. “Proposals that sit past day 17 win less than half as often, and one is sitting at day 18 right now” is a task you can assign on Monday.
Why give this away?
The skill tests one number: is your best quarter real, or could it be luck? Marketing Systems Guild does the same thing to a whole plan. I won’t argue. I’ll bring your ideas and visions into the real world and either prove it or fail it.
This skill tells you which fix is worth the most. Proving that fix and building what survives is what Marketing Systems Guild does.
Every month, The Cold Take releases a free skill like this one. The next one is coming soon.
Until next month, keep your CRM honest,
Bill
Marketing Systems Guild. Build it. Prove it. Scale it.