

This free Claude skill reads your deal export, shows you which channels actually close deals, and helps you decide where to invest your next dollar.
This is a common scene at budget meetings. Marketing explains which channels bring in leads. Sales says those leads aren’t good enough. The CEO finds a compromise and moves on. Still, no one can say for sure which channel led to closed deals, even though the CRM has the answer.
This month’s skill solves that problem. It’s free, works inside Claude, and keeps your data private in your session.
What is the problem?
This is a common problem: no one can say which channel brings in closed revenue. People might know which channels get leads, clicks, or meetings, but those are different questions. As a result, budgets are often based on the wrong data.
The gap can be seen in three places.
The scoreboard often stops too soon. Channels are judged by top-of-funnel results like form fills, MQLs, and booked calls. A channel might look good on paper but still fail to deliver closed revenue. It’s easy to buy more leads, but much harder to get actual deals.
The data source often has problems, and no one checks it. Some deals don’t have a contact linked. Imports might just be labeled as “Offline.” One person types “linkedin” as the source, another writes “LinkedIn Ads.” Renewals keep the original deal’s source, making old channels look bigger than they are. Lost deals are sometimes deleted instead of marked as lost, so there’s no win rate. Each issue might seem small, but together they let the report show whatever the preparer wants.
Channels aren’t always the right unit to measure. For example, “paid search” isn’t just one thing. Branded search is for people already looking for you. Conquesting search tries to win over competitors’ customers. Non-brand search targets people who don’t know you yet. Each type works differently and needs its own budget. If you lump them together, the bigger one hides the smaller ones.
What does that cost?
It costs money in three ways.
First, you might spend money on channels that seem active but don’t close any deals. If a channel brings in 25% of your deals but only 5% of your revenue, it’s not a real lead engine. It just wastes your reps’ time.
Second, you might not invest enough in the channel that actually closes deals, just because it doesn’t show big numbers on a lead report.
Third, you lose time. Every quarter, the same argument happens because no one has a number everyone trusts. The decision gets pushed off, and putting it off is the most expensive option.
What does the skill do?
You upload a deal export from HubSpot, Salesforce, or any CRM. Claude shows you revenue, win rate, and sales cycle by source, checks if your data is reliable, and creates an interactive report with a budget optimizer.
The math is fixed. A script handles every calculation, so you get the same answer from the same file every time. Claude reports exactly what the numbers say and never makes up or rounds its own results.
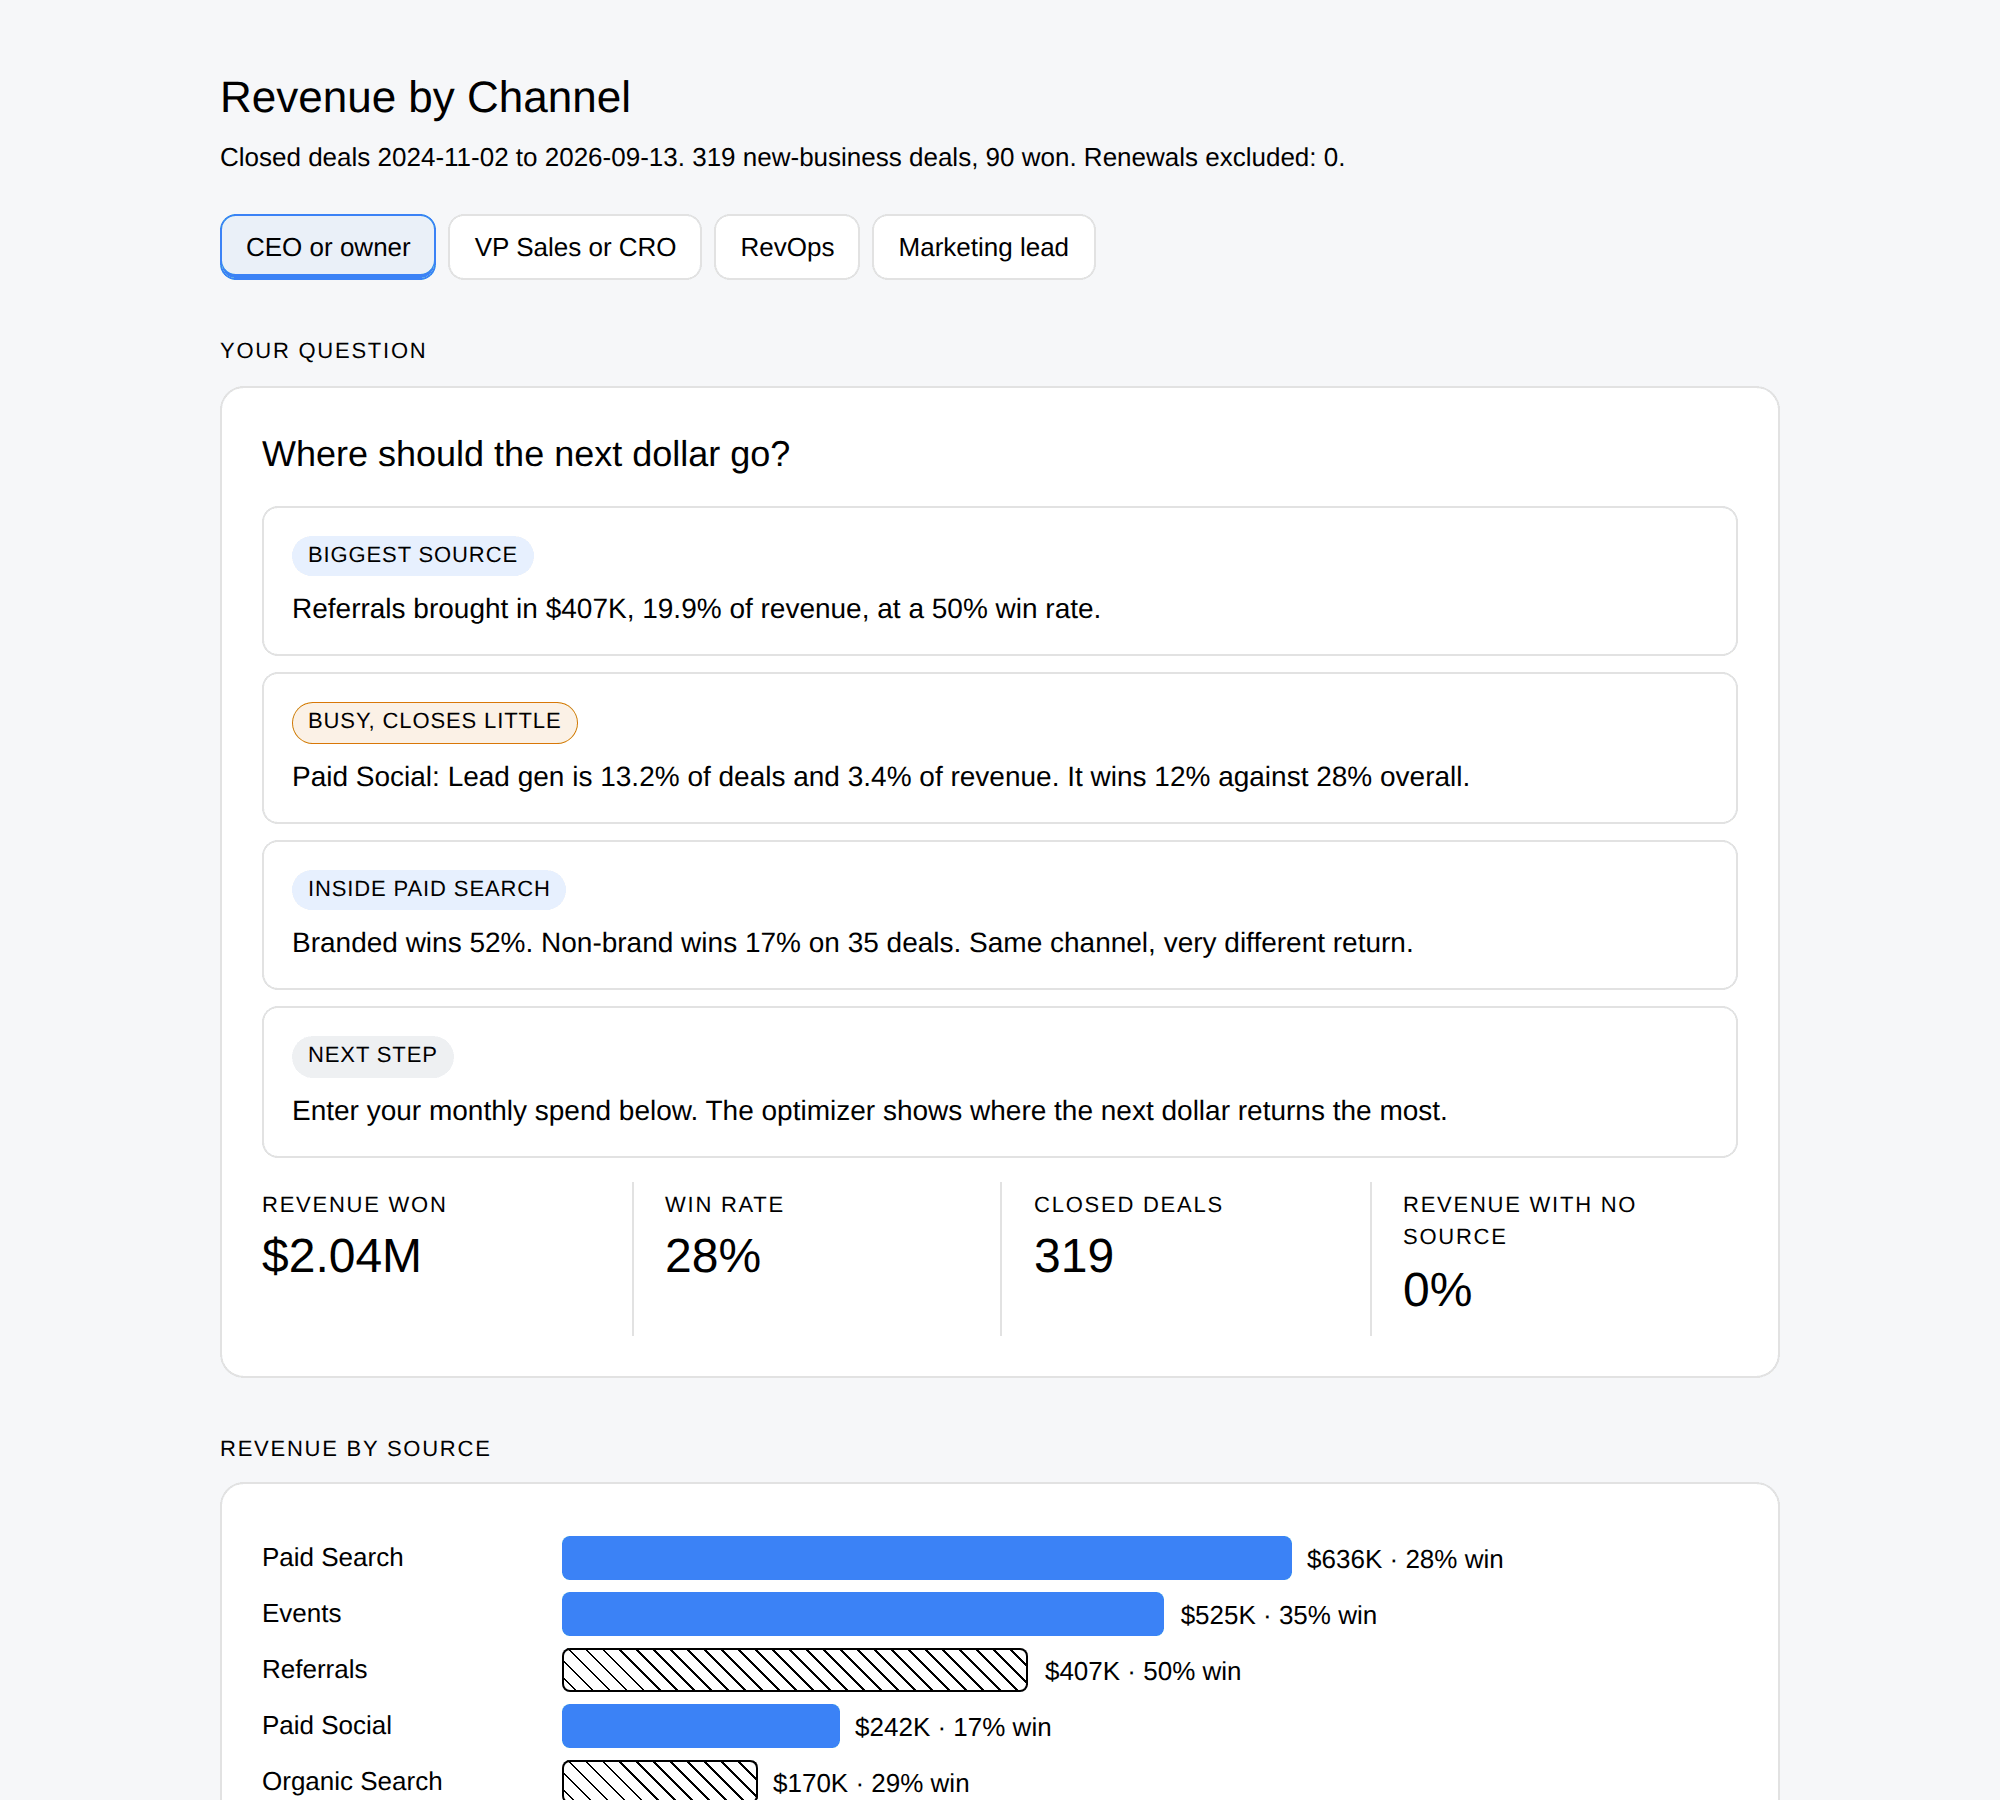
Here is the first screen a CEO sees, run on the sample file that ships with the skill.
Who is it for?
The tool is designed for four roles, since each one looks at the data differently. You tell Claude your role. The analysis stays the same, but the answer is tailored to you.
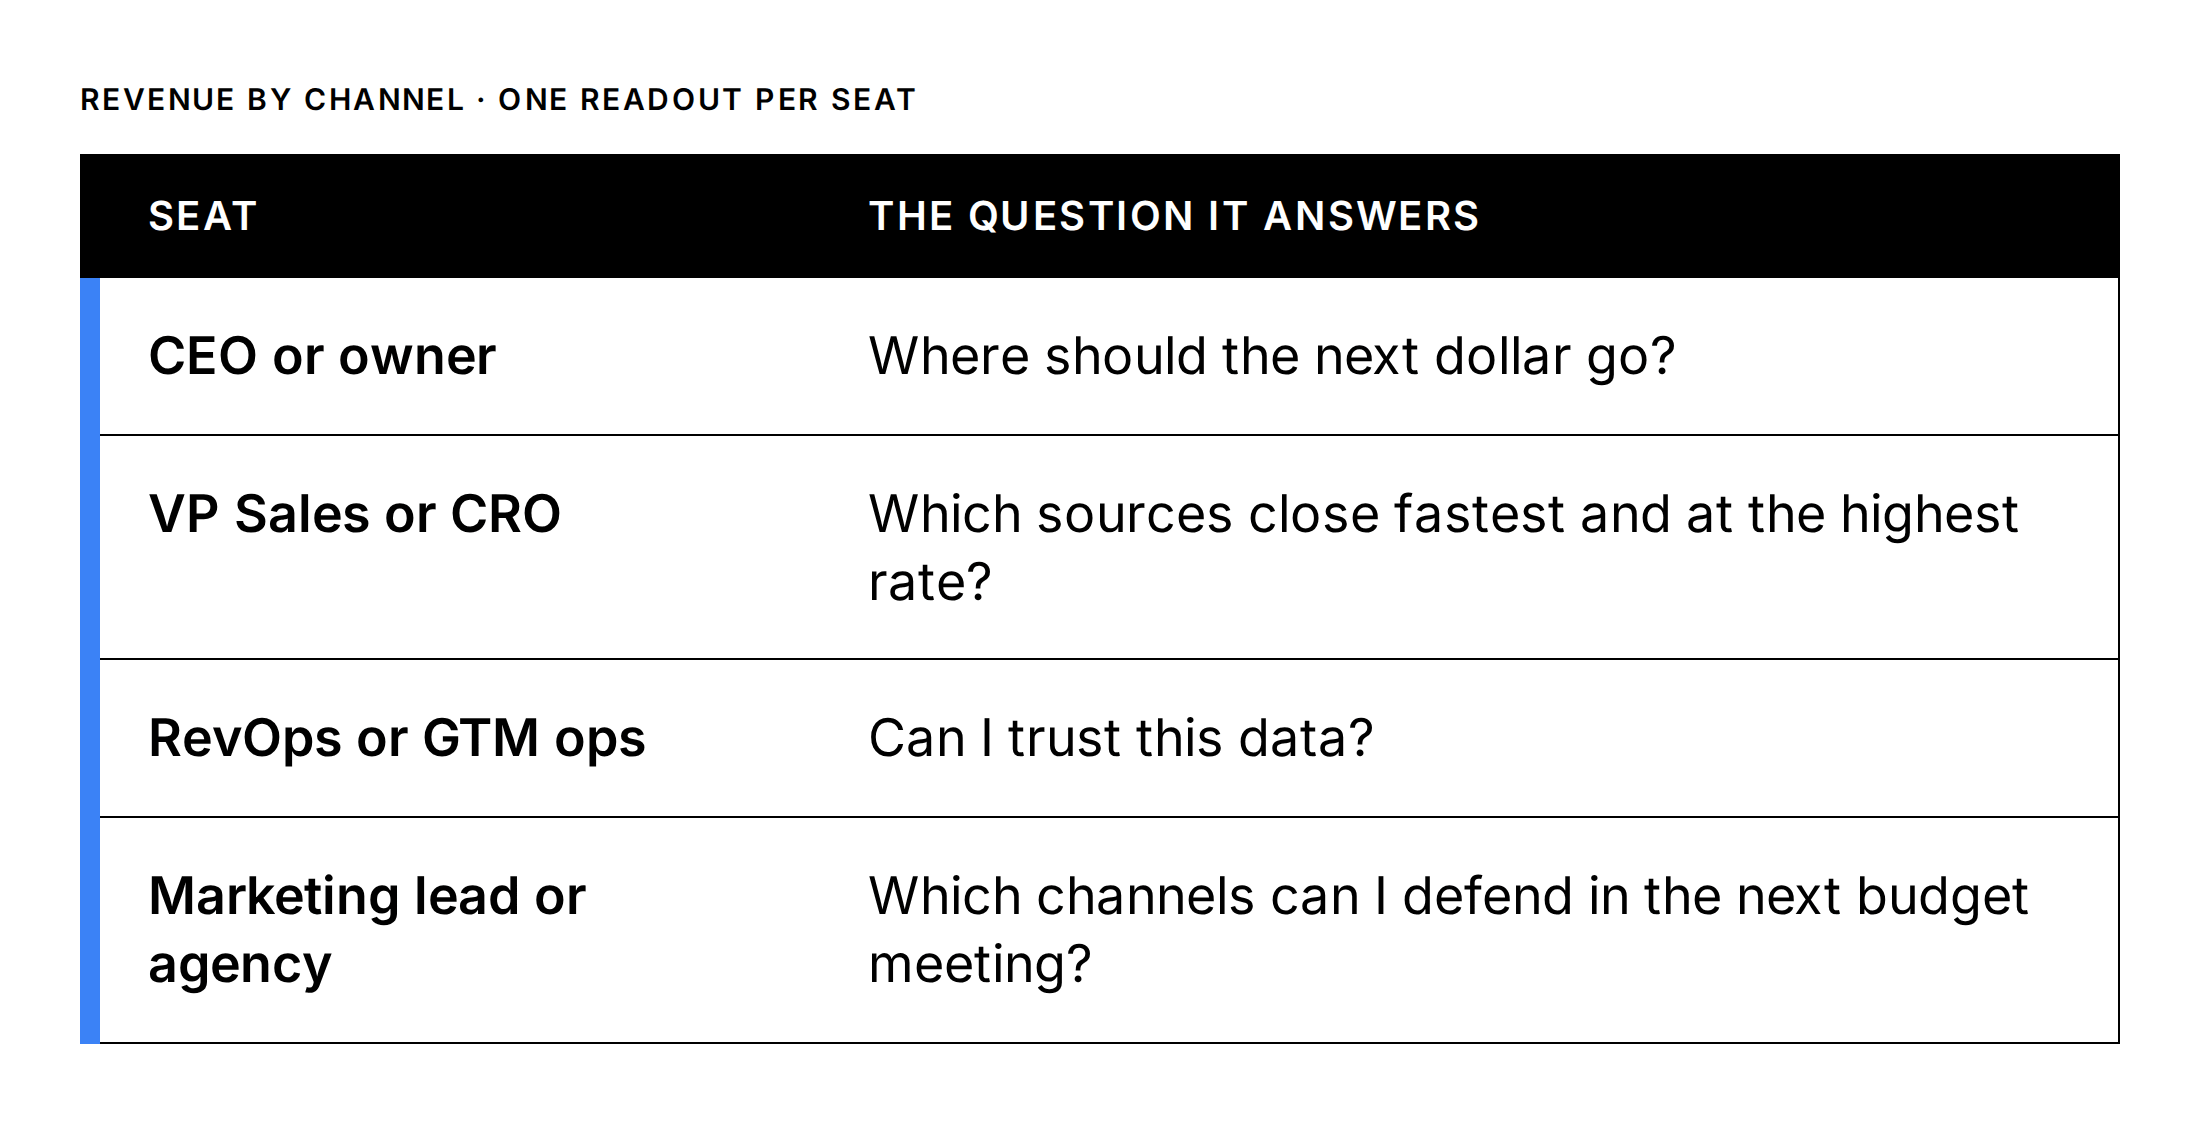
The CEO gets a three-line answer and one suggested budget move. The CRO gets win rate and sales cycle by source, plus advice on which leads should get rep time first. RevOps gets a trust check and a ranked list of CRM fields to fix. Marketing gets the same comparison the CFO will use: each marketing channel versus referrals.
What does it check before it answers?
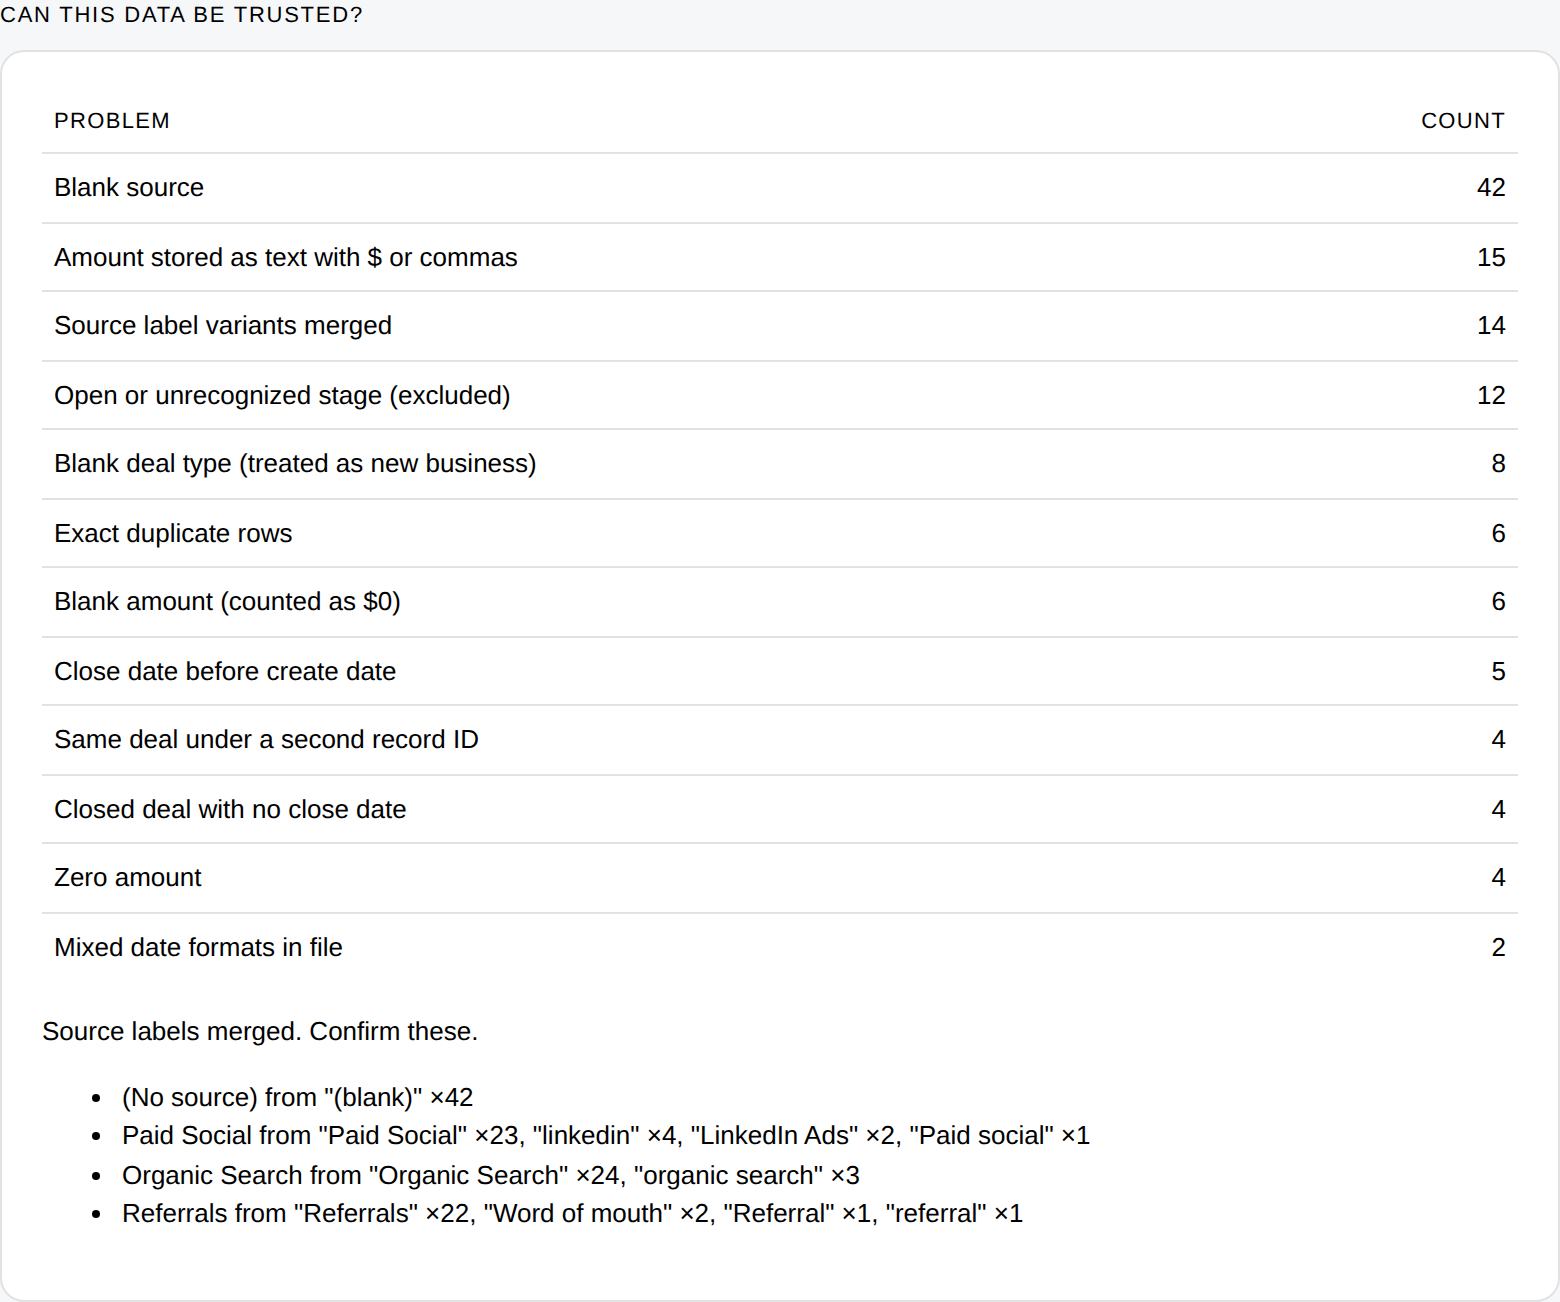
It checks if your data is good enough for an answer. Before making any recommendations, the skill counts every problem in your file: duplicate deals, the same deal under two IDs, open and closed deals mixed together, blank sources, spelling differences, amounts saved as text, mixed date formats, and deals that closed before they were created.
If more than 20% of your revenue has no source, the report changes for everyone. It starts by highlighting the data problem, because making budget decisions with that file would just be guessing.
It doesn’t try to fill in missing data. If a source is blank, it stays as “(No source).” If a channel has fewer than 10 deals, it just shows the count, like “3 of 7,” instead of a win rate. Three wins out of seven isn’t 43%. It’s just three wins out of seven.
This is the trust check on the messy sample file. Every problem gets counted before any answer.
How deep does it go?
If you add a campaign column to your export, the tool breaks down each channel by what the campaigns were designed to achieve.
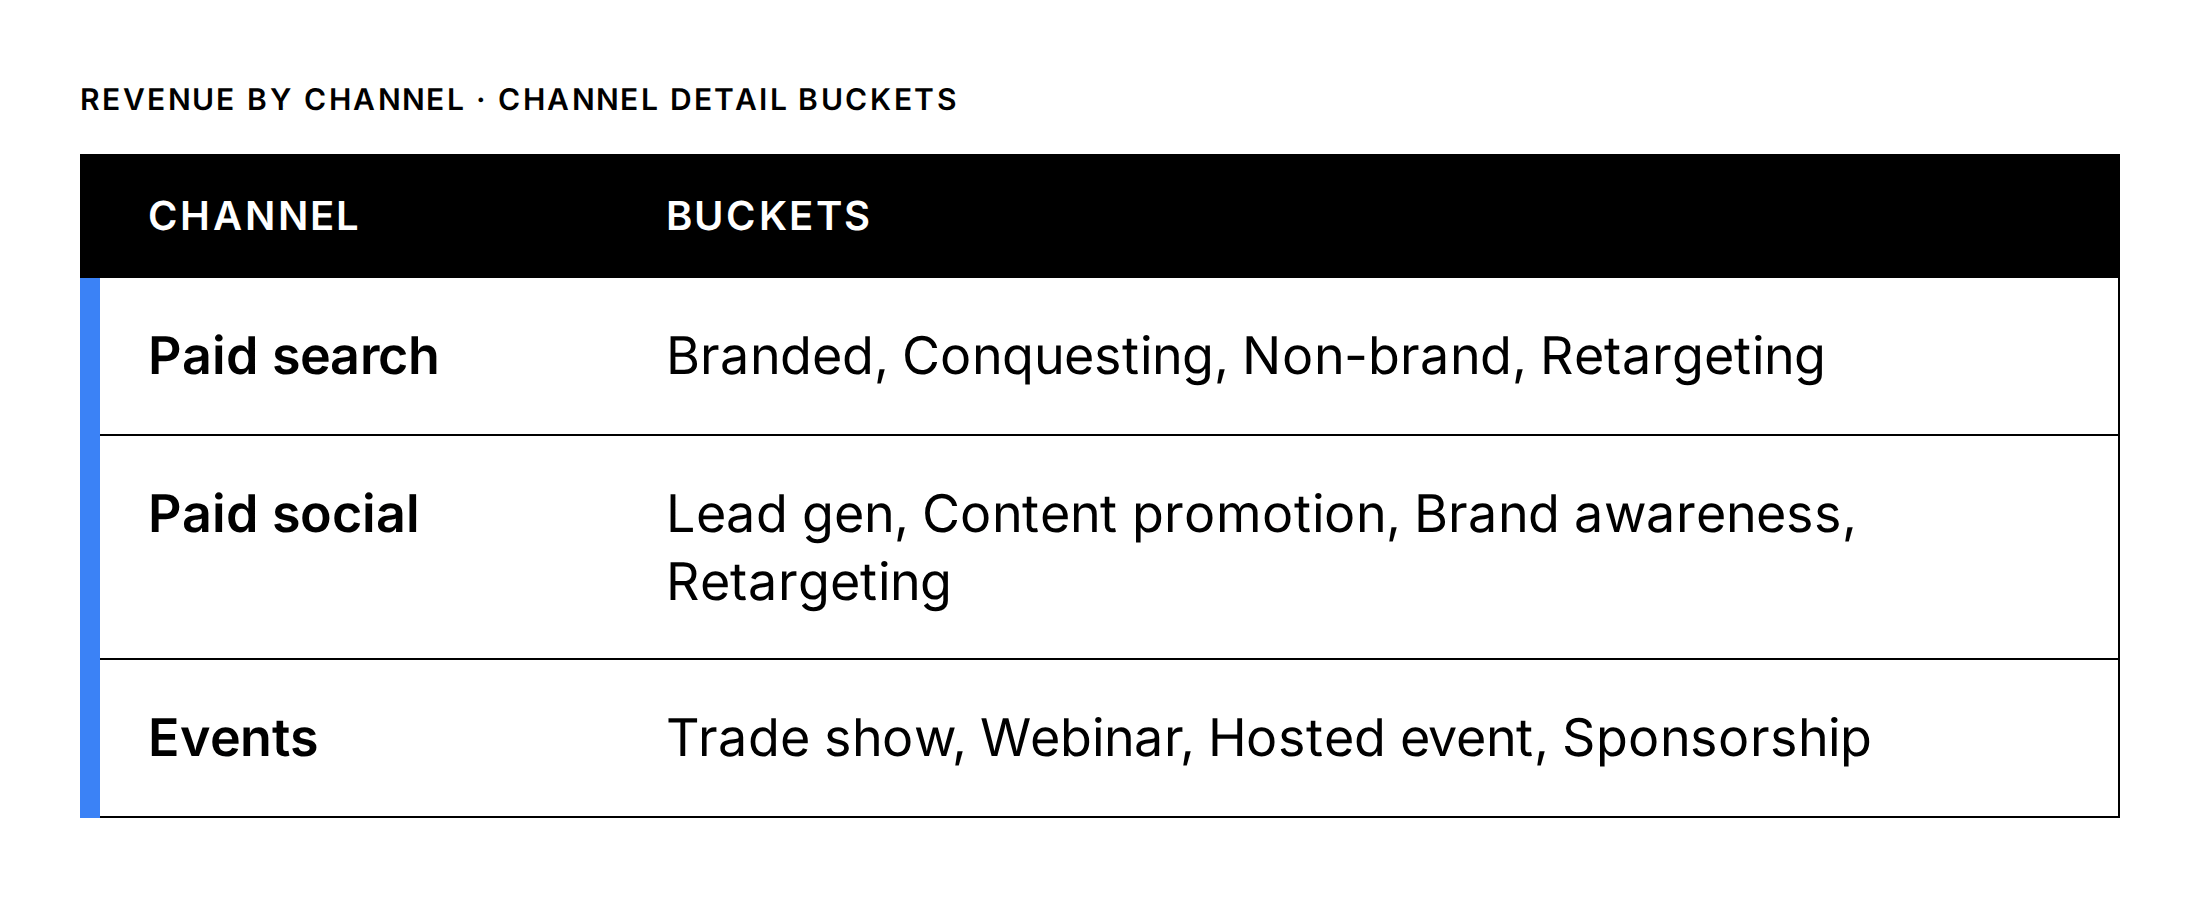
It sorts campaigns by keywords in their names. If it can’t read a name, it puts it in “Unclassified.” The number of unclassified campaigns shows you which ones need better names.
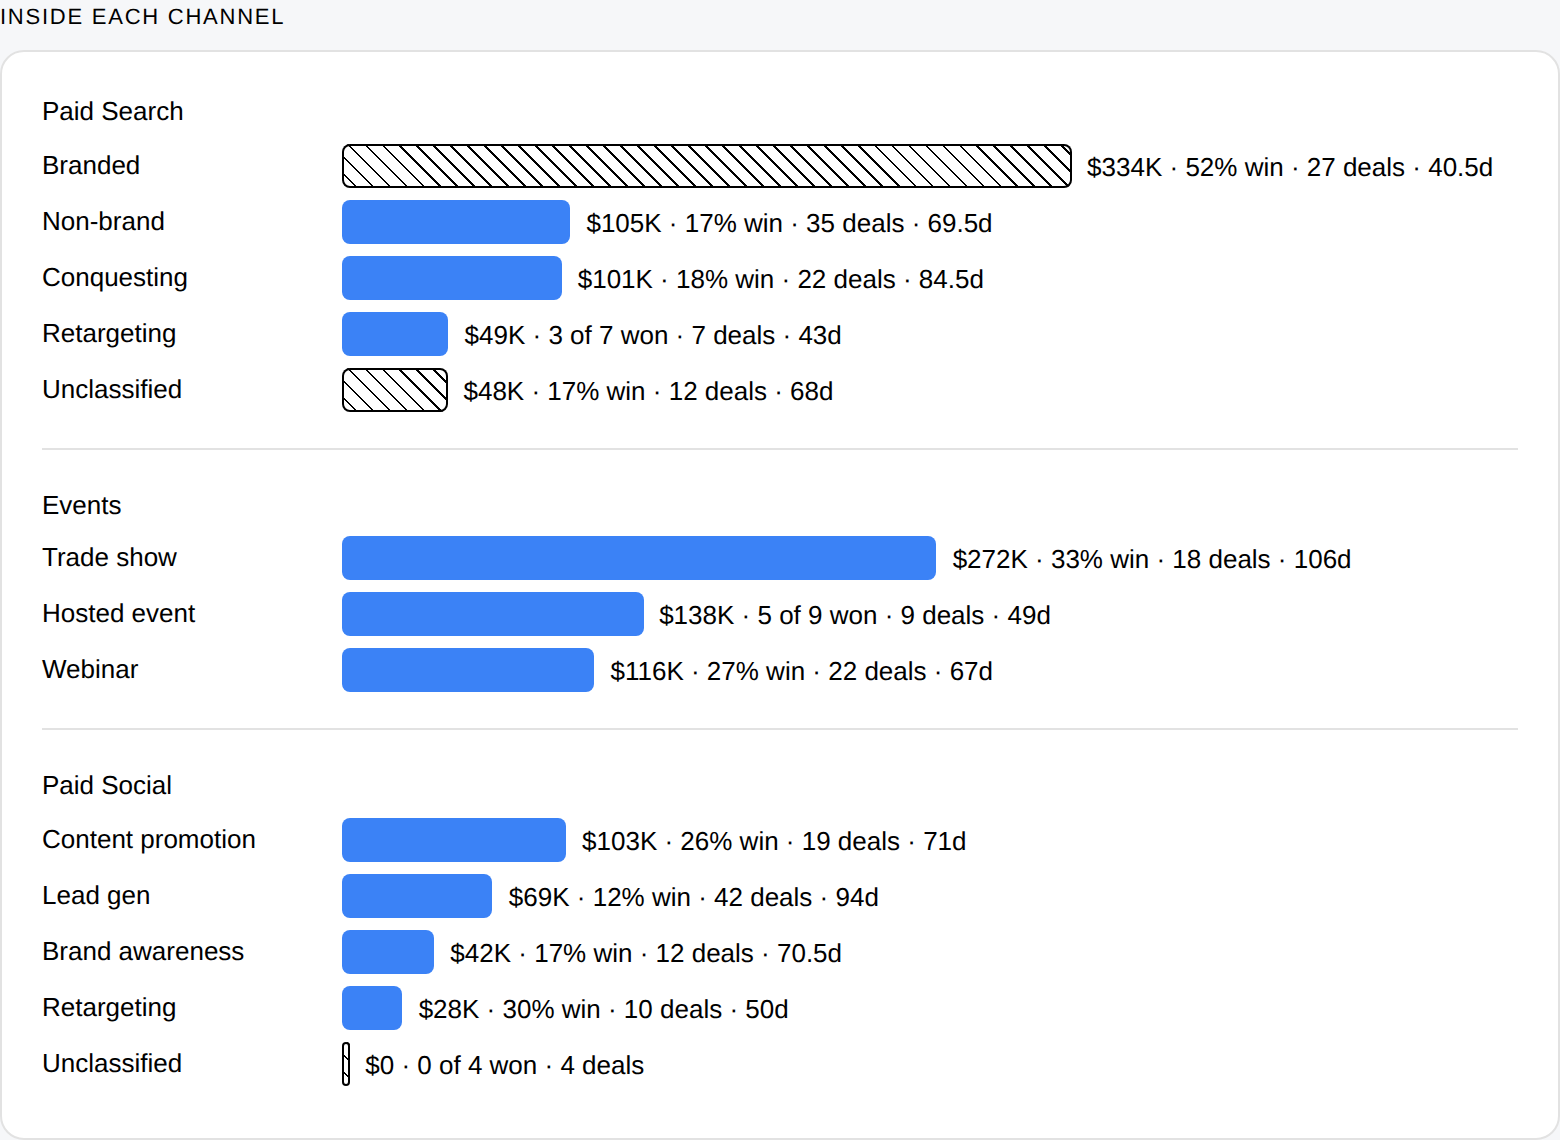
Here is what the split looks like on the sample file that ships with the skill. The sample is built to behave like a small B2B firm. It is not client data.
At the channel level, paid search looks fine: 103 deals, a 28% win rate, right on the company average.
Inside it, branded search wins 52% of 27 deals. Non-brand wins 17% of 35.
On LinkedIn, lead gen campaigns produced 42 deals and won 12%. Content promotion produced 19 and won 26%.
Same channel, but very different results. A channel-level report might tell you to keep spending on paid search and lead gen campaigns. By breaking it down, the report lets you see the real differences right away.
Why doesn’t it tell me to spend more on branded search?
That’s because branded search only captures demand that’s already there. People clicking already know your name. Spending more just means paying more for the same buyers. A strong branded search result shows that something else created the demand: referrals, content, events, or word of mouth.
So, the skill never suggests increasing branded search, and the optimizer keeps it fixed by default. It does the same for referrals, offline and unsourced revenue, since you can’t buy those, and for organic search, which takes 6 to 12 months to show results.
What does the budget optimizer do?
It finds the best mix to get the most closed revenue for your budget, or the lowest spend needed to reach your revenue goal.
You enter your monthly spend for each channel or group. The export doesn’t include spend data, so all cost numbers come from what you type in, and they stay in your browser. Each channel or group gets its own row, and the fixed lines are already turned off.
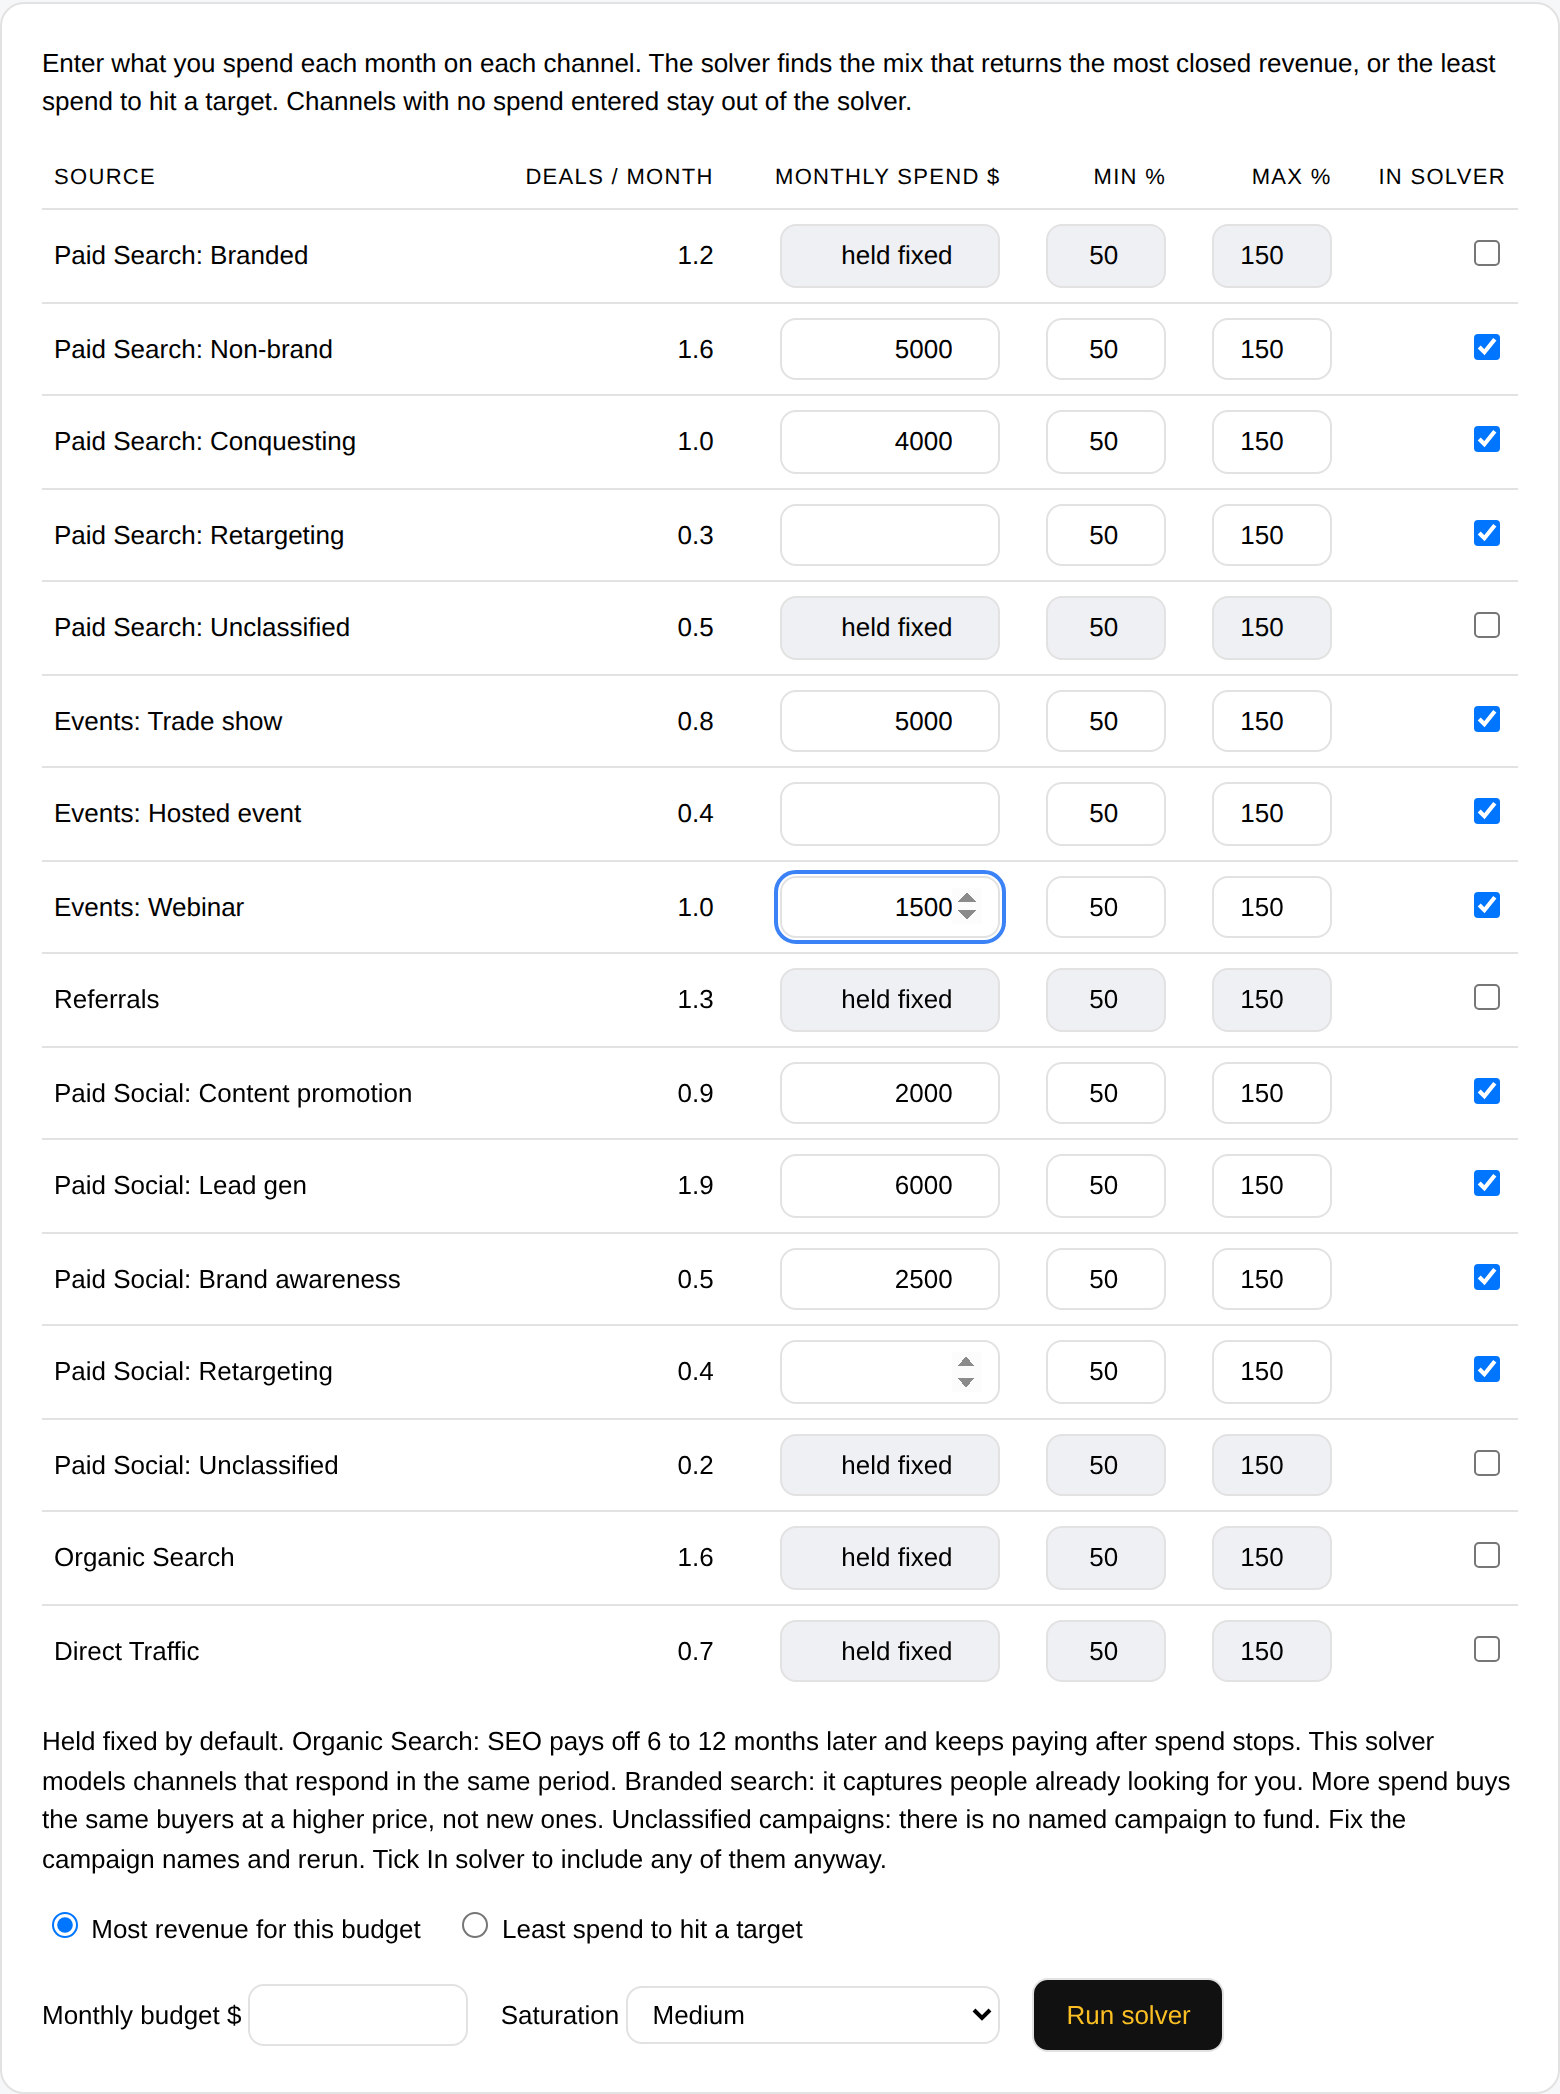
Behind the scenes, it uses a linear program that accounts for diminishing returns. As you spend more on a channel, its results level off. The tenth thousand dollars on LinkedIn won’t perform as well as the first. This prevents the optimizer from putting your whole budget into one channel. Each channel also stays within limits you set, usually 50% to 150% of your current spend, so a small data set can’t eliminate a channel completely.
How honest is the forecast?
It gives you a range, and the range depends on your data. The base case uses each channel’s real win rate. The worst and best cases use the low and high ends of a 90% confidence range. If a channel has 45 deals, the range is narrow. If it has only 9, the range is much wider.
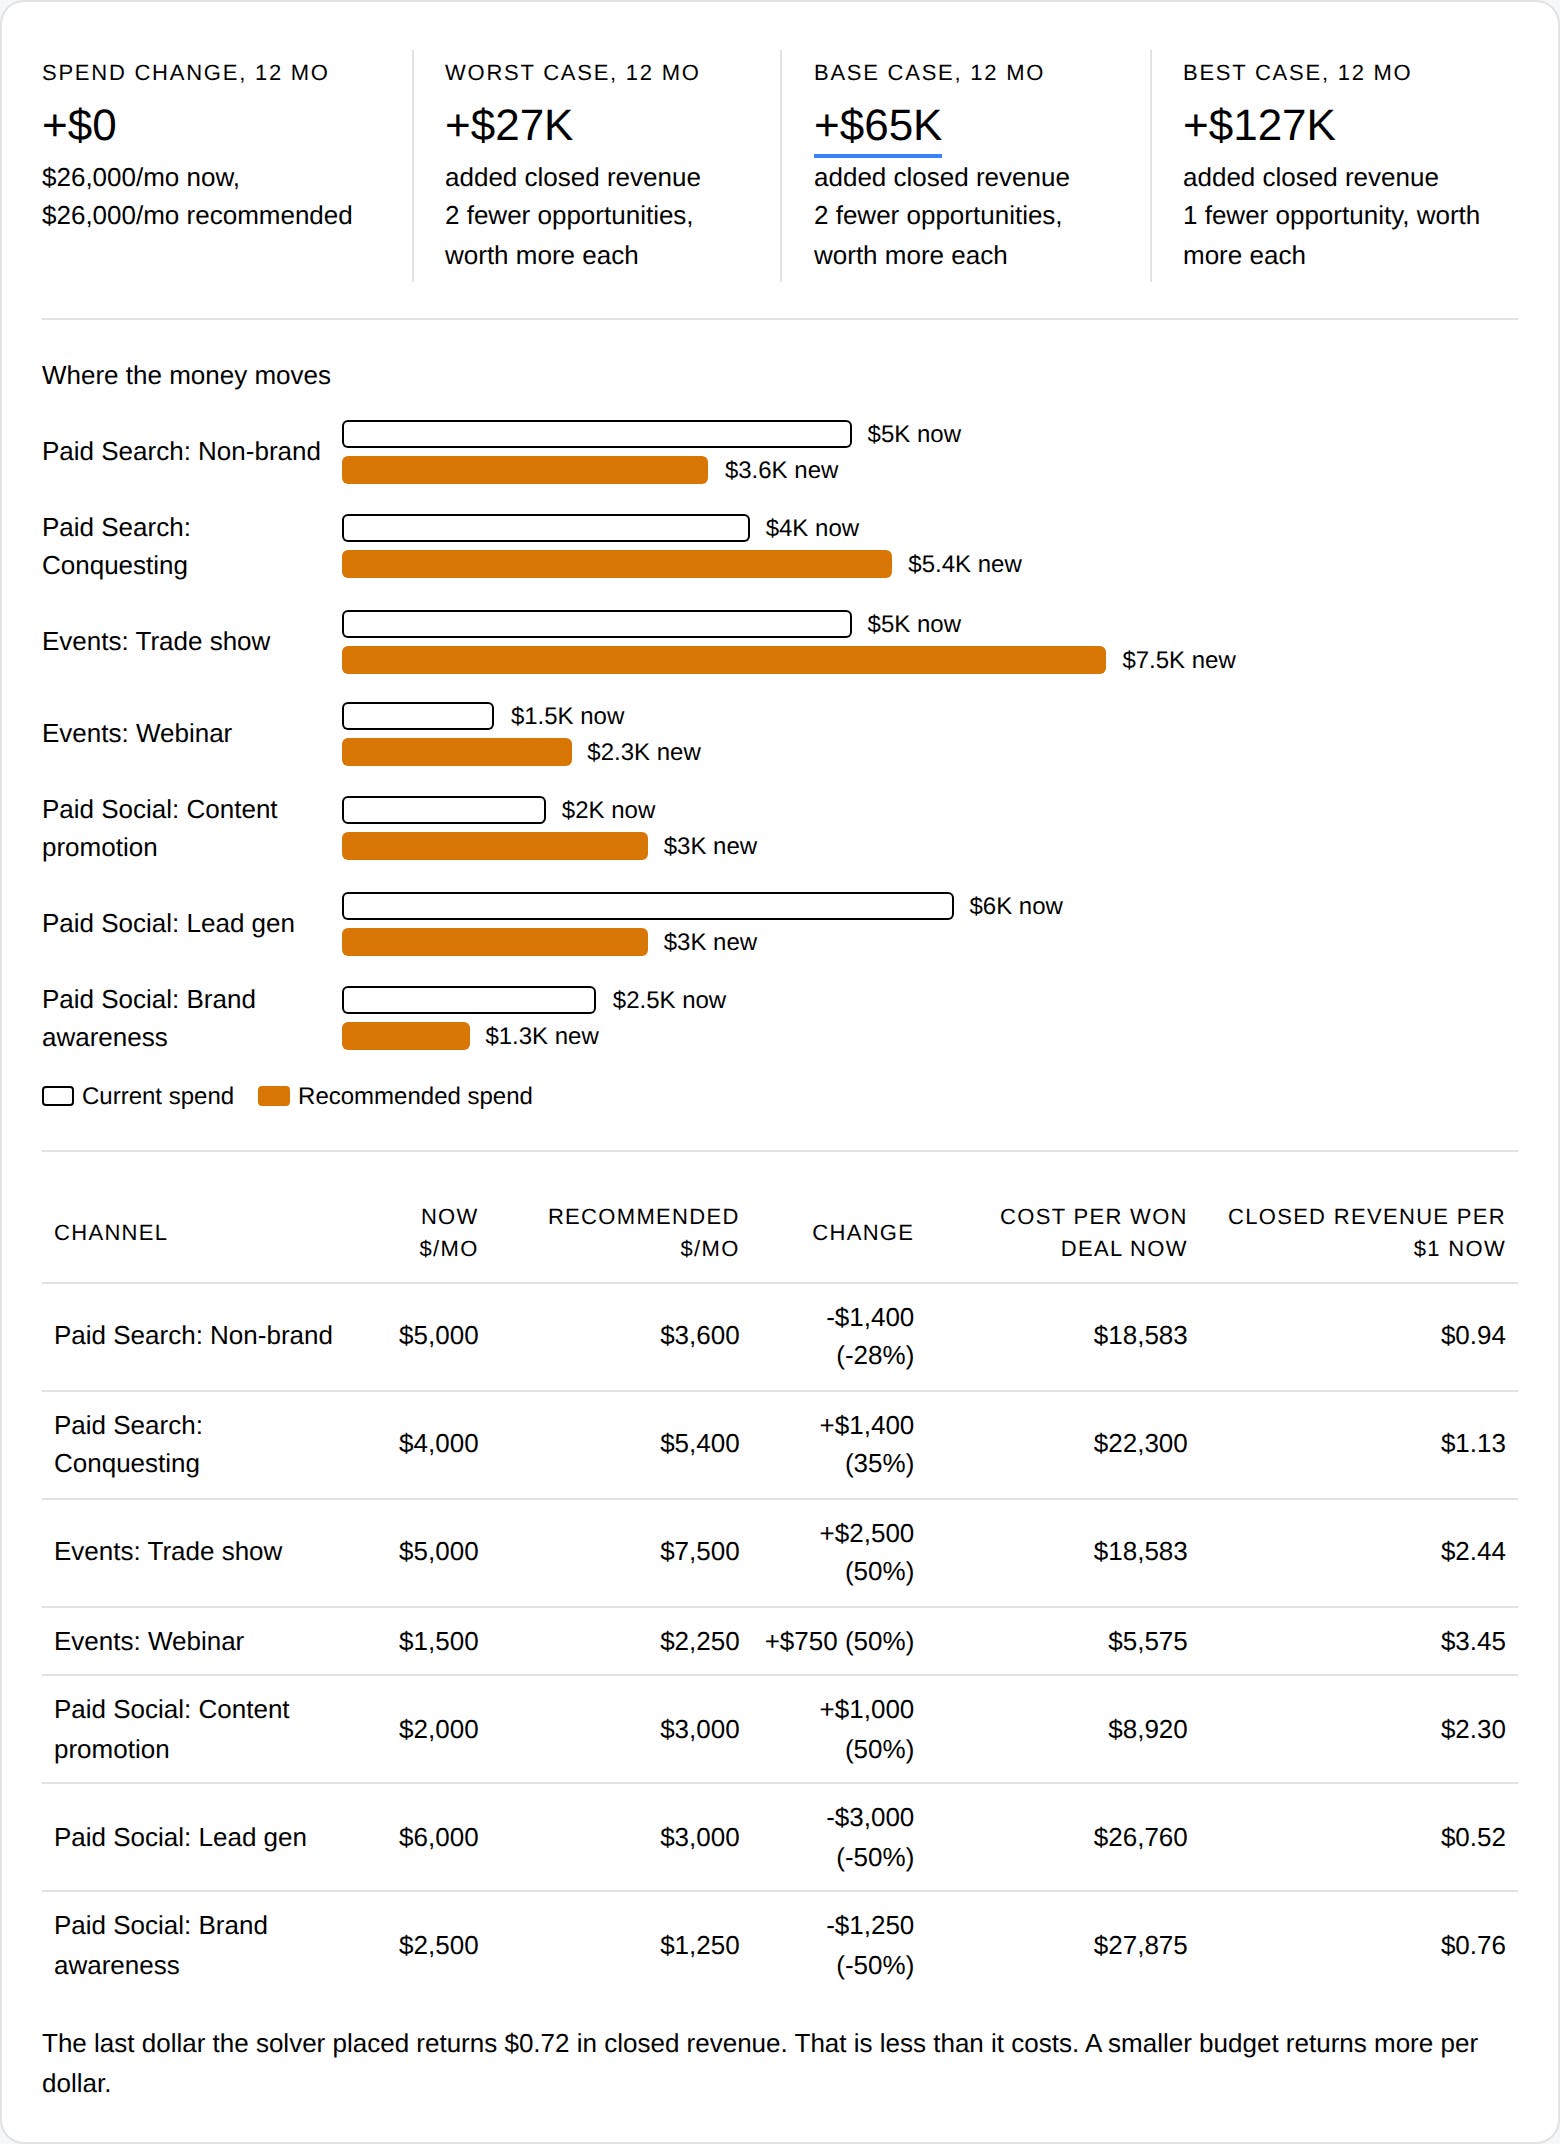
In the sample file, with a sample spend of $26,000 a month, the solver kept total spend the same but shifted $5,650 a month away from LinkedIn lead gen, non-brand search, and brand awareness. That money went into trade shows, conquesting, content promotion, and webinars. The expected result: about $65,000 more closed revenue over 12 months, with a realistic range of $27,000 to $127,000.
It also pointed out the limit. After about $21,500 a month, each extra dollar brought in less than a dollar in closed revenue. That means you’d lose money, no matter your margin. Here’s the full result.
What does it tell me in plain language?
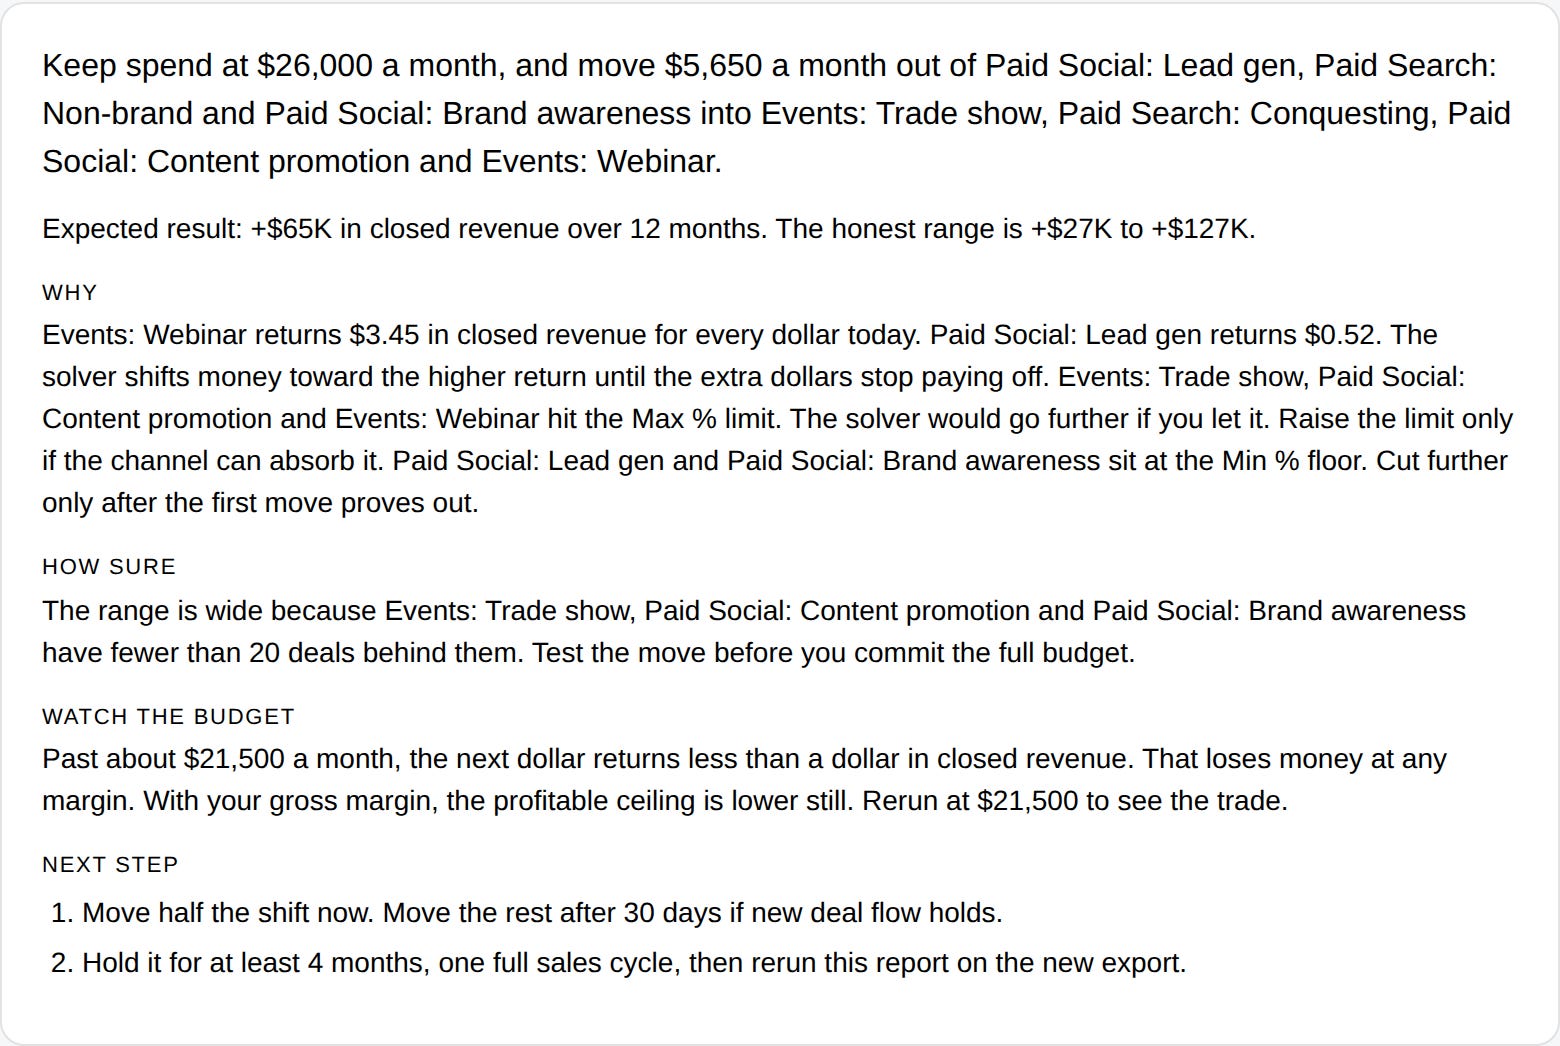
Each run ends with a written recommendation. It explains what to move, what it’s worth, why, how confident to be, when extra budget stops helping, and what to do next. The next step is always the same: move half the budget now, move the rest after 30 days if deal flow is steady, then rerun the report after a full sales cycle. Here’s the exact recommendation from the run above.
If you decide to cut the budget, it tells you how much you’ll save, what you’ll lose in closed revenue, and whether the cut will actually increase your profit at your margin.
What do I need before I run it?
The skill uses whatever your CRM recorded. If your CRM didn’t track where a deal came from, no analysis can fill in that gap. Here’s what you need, from the basics to the full answer.
To run it at all
Any Claude plan, Free included, with code execution turned on
A CSV of won and lost deals from the last 12 to 24 months
Five columns: deal stage, amount, create date, close date, source
At least 20 closed new-business deals. 50 or more is where the answer gets useful
To trust the answer
Your CRM’s tracking code on every page of your site
Every form on the site feeding the CRM
A contact attached to every deal in HubSpot, because HubSpot sets a deal’s source from its earliest associated contact
Lead source carried over on conversion in Salesforce
Offline leads labeled when they are entered
Deal type set on every deal, new or existing
Lost deals marked Closed Lost, not deleted
For the channel detail
UTM tags on every paid link
One campaign naming pattern, used every time, with the objective as a plain word. The pattern I use: platform-objective-theme-audience-YYYYMM, for example linkedin-leadgen-diagnostic-cmo-202606
The campaign fields in your export. In HubSpot, that means both Original Traffic Source drill-down columns, because HubSpot stores the campaign name in drill-down 1 for paid search and drill-down 2 for paid social
For the optimizer
Monthly spend per channel or bucket
Your gross margin, to judge whether the extra revenue is worth it
No connectors, no integrations, no API keys. It works from the file you upload.
What if my data is a mess?
Run it anyway. That’s the first thing you’ll learn.
The RevOps readout turns every problem into a ranked list of fixes: which field to fix first, so next quarter’s export is clean. In the messy sample file, 37% of revenue had no source, making “(No source)” the biggest revenue line. The right move isn’t to shift the budget. It’s to fix the source field before debating channels again.
How do I get it?
Download the skill from GitHub.
In Claude, go to Customize > Skills > + > Create skill > Upload a skill.
Turn on code execution.
Export your deals, won and lost, and upload the CSV.
Tell Claude your seat: “Where did our revenue come from? I’m the CEO.”
No export handy? The repo includes three sample files. Try the campaign sample first and watch the channel detail work.
What does this unlock?
A number that both sides of the budget meeting can agree on.
For the CEO, this means the next dollar goes to what actually closes deals, and the quarterly argument is over. For sales, reps spend time on sources that win. For RevOps, there’s a fix list with field names. For marketing, it’s a defense based on closed revenue, the only kind a CFO will respect.
It also turns a vague problem into something specific. Saying “Our attribution is bad” is just a complaint. Saying “37% of revenue has no source because deals are created without a contact attached” is a task you can assign on Monday.
Why give this away?
The hardest part of demand generation isn’t the analysis. It’s building the system that makes the analysis possible: tracking, naming, handoffs, and the discipline to mark a lost deal as lost. That’s what Marketing Systems Guild does.
This skill shows you exactly where you stand. If it reveals you need to build a better system, you know where to find me.
Every month, The Cold Take releases a free skill like this one. The next one is coming soon.
Until next month, keep your CRM honest,
Bill
Marketing Systems Guild. Turning strangers into clients.