

Marketing Mix Model is a free skill in Claude. Just upload your weekly sales and spending by channel. The tool breaks down each week’s sales to show what caused them, calculates sales per dollar, predicts the next dollar’s return for each channel, and helps you find the best way to split your budget.
Here’s the problem: every ad platform claims credit for the same sale. When finance asks what marketing actually delivers, no one has a solid answer.
The value: you get a clear Grow, Hold, Trim, or Cut decision for each channel, a direct read on how confident the model is, and a ranked list of channels to test before shifting your budget.
How does it work?
The model uses ridge regression on your weekly data. It breaks down each week’s sales into base sales, trends, seasons, holidays, events, outside factors like price and the economy, and the impact from each channel.
Two things make media different from everything else in the file:
Carry-over: Some of this week’s spending keeps having an effect next week. TV’s impact fades over several weeks, while search mostly works right away. The model figures out the rate for each channel.
Saturation: The first dollars you spend reach the easiest buyers. Each extra dollar brings in fewer new customers. The model finds the point where each channel’s results start to slow down.
Next, the model refits itself 40 times using resampled versions of its own misses, including carry-over and saturation effects. Claude then creates a readout tailored to your role and builds an interactive tool you can open in your browser.
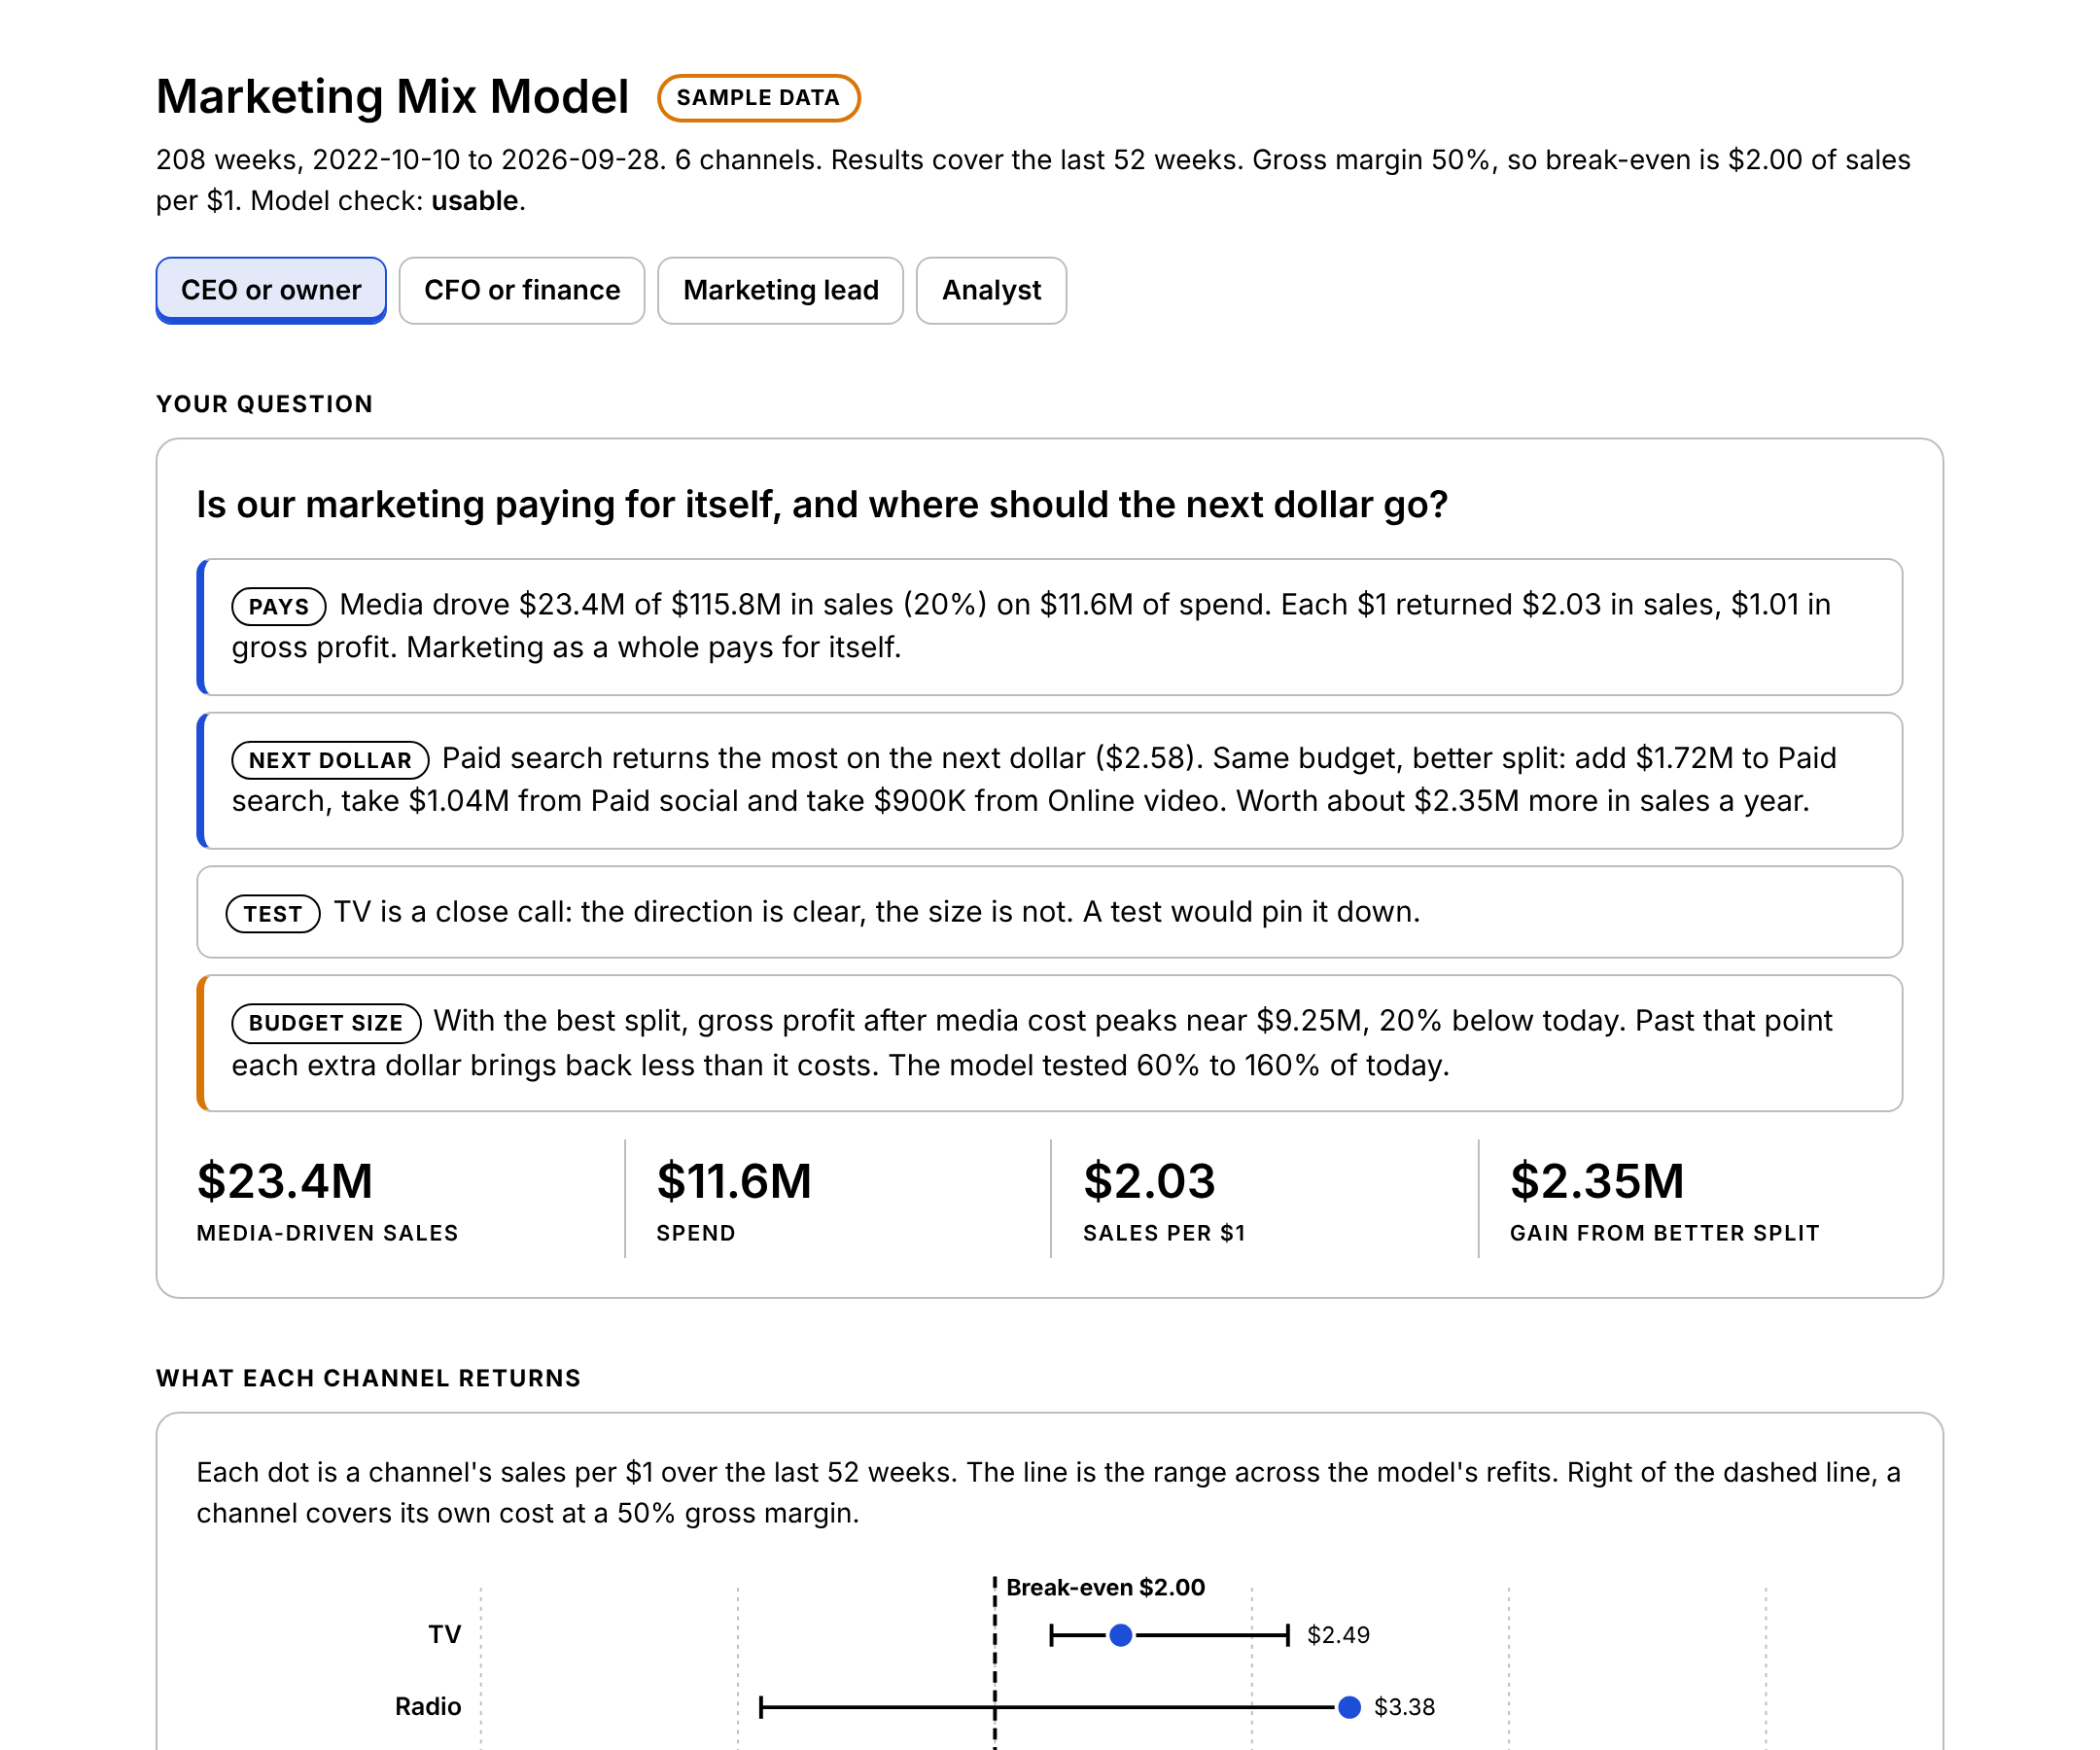
Sample data is synthetic and published with the repository.
Isn’t marketing mix modeling dead?
The old version is outdated. It was built once, gave just one number per channel, didn’t show where it was guessing, and came with a big bill.
This one does three things the old version does not:
It tells you which answers hold across 40 refits and which ones move.
It holds a channel’s budget still when the model cannot settle it.
It takes your lift test results and anchors those channels to them.
Use the model to choose what to test, and use your test results to guide the model.
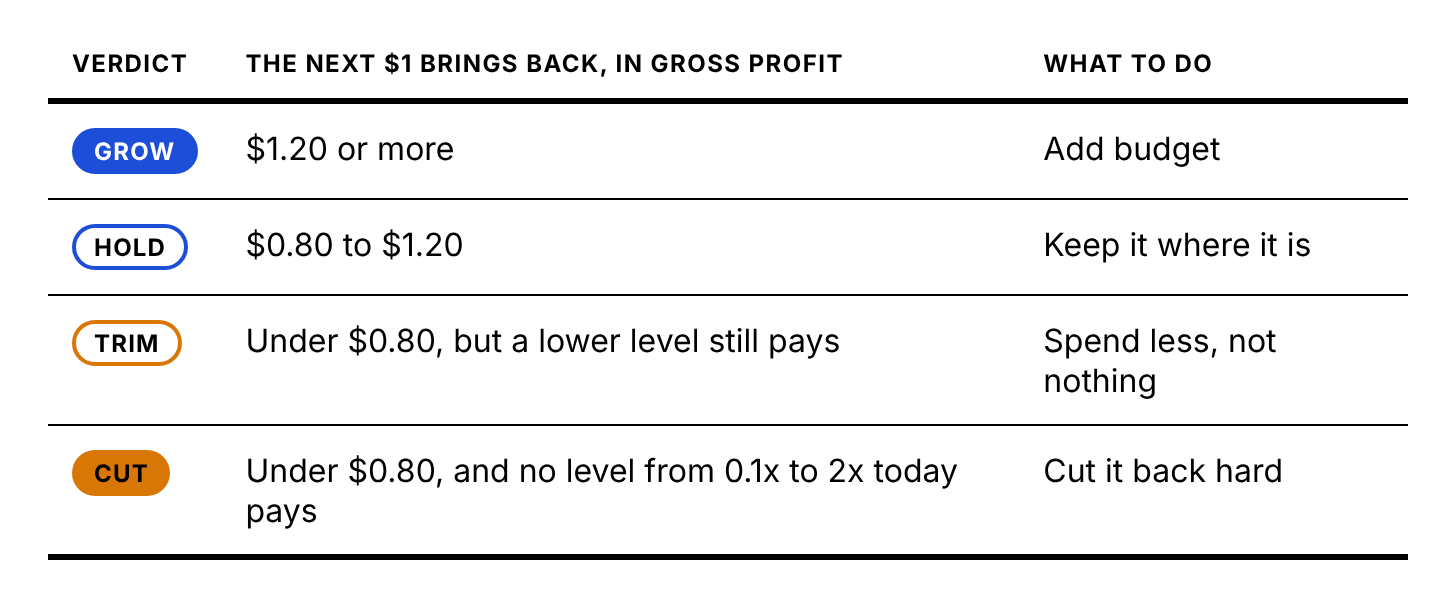
What do Grow, Hold, Trim, and Cut mean?
Every decision starts by looking at the next dollar spent, based on your gross margin.
Each decision also comes with a confidence level.
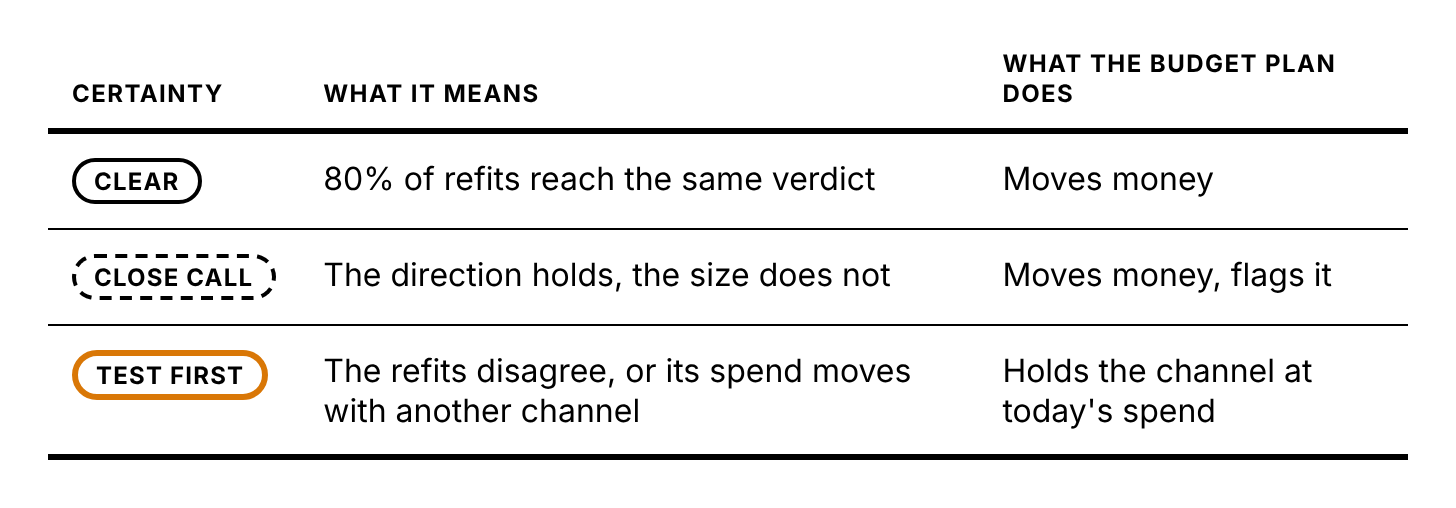
The plan never increases spending on a Cut or Trim channel, and never reduces spending on a Grow channel.
What does the readout look like?
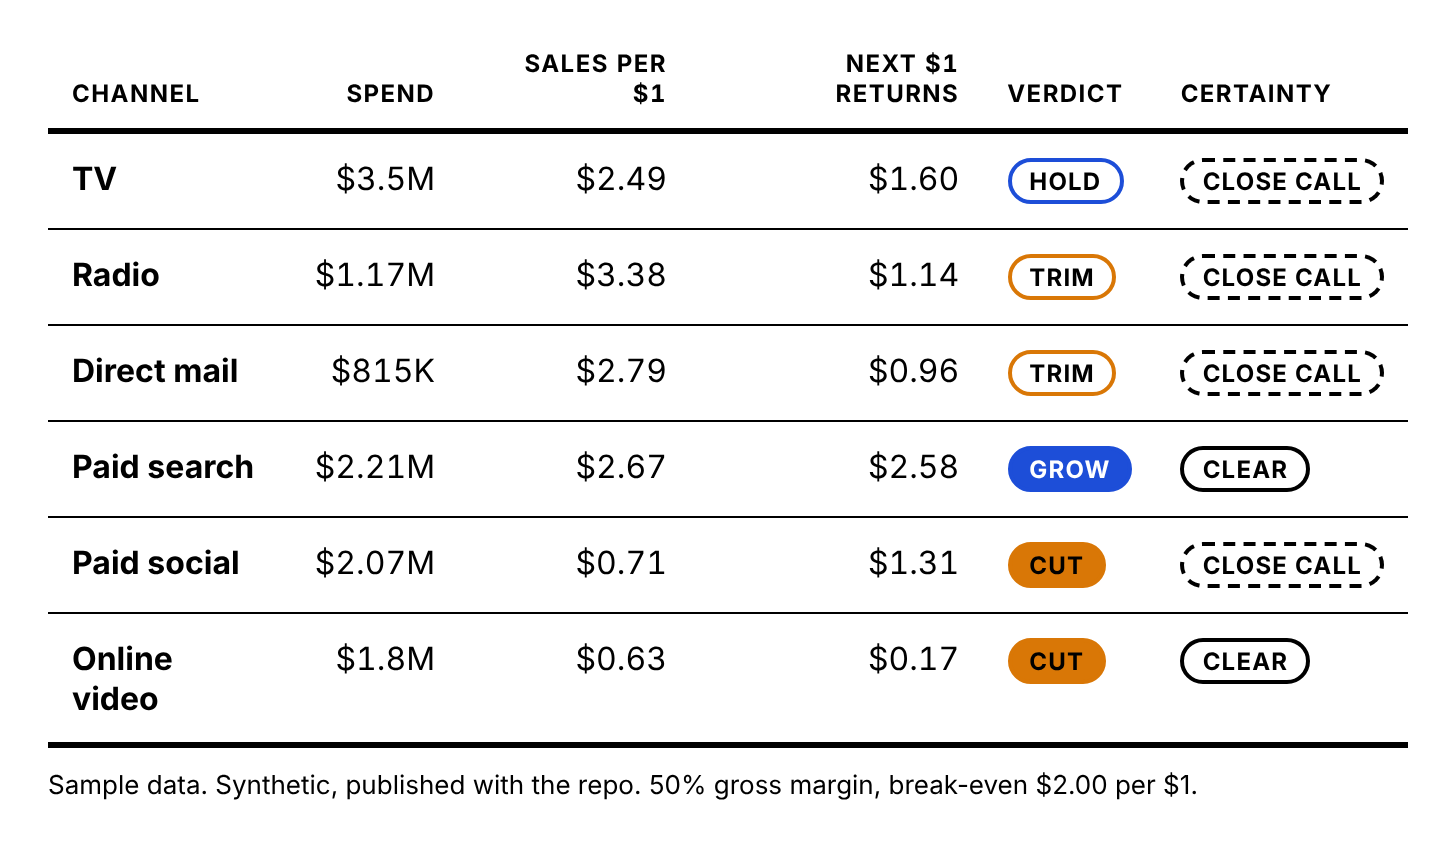
Here’s the sample file: 208 weeks, six channels, and a 50% gross margin. Break-even is $2.00 in sales for every $1 spent.
Here are three lines a CEO can read in 30 seconds:
Media drove $23.4M of $115.8M in sales on $11.6M of spend. Each $1 returned $1.01 in gross profit. Marketing as a whole barely breaks even.
Same budget, better split: add $1.72M to Paid search, take $1.04M from Paid social and $900K from Online video. Worth $2.35M more in sales a year.
Gross profit after media costs peaks at about $9.25M, which is 20% below today’s budget.
Why does the next dollar matter more than the average?
The average shows what a channel has done so far. The next dollar shows what extra spending will do.
Radio averages $3.38 per $1, the highest in the file. But its next dollar only returns $1.14, which is below break-even. Radio worked in the past, but spending more won’t help now.
Paid social is the opposite. It averages $0.71 per $1, but its next dollar returns $1.31. It’s at the slow start of an S-curve. Still, the model calls it Cut, because no spending level from a tenth to double today’s amount covers its cost.
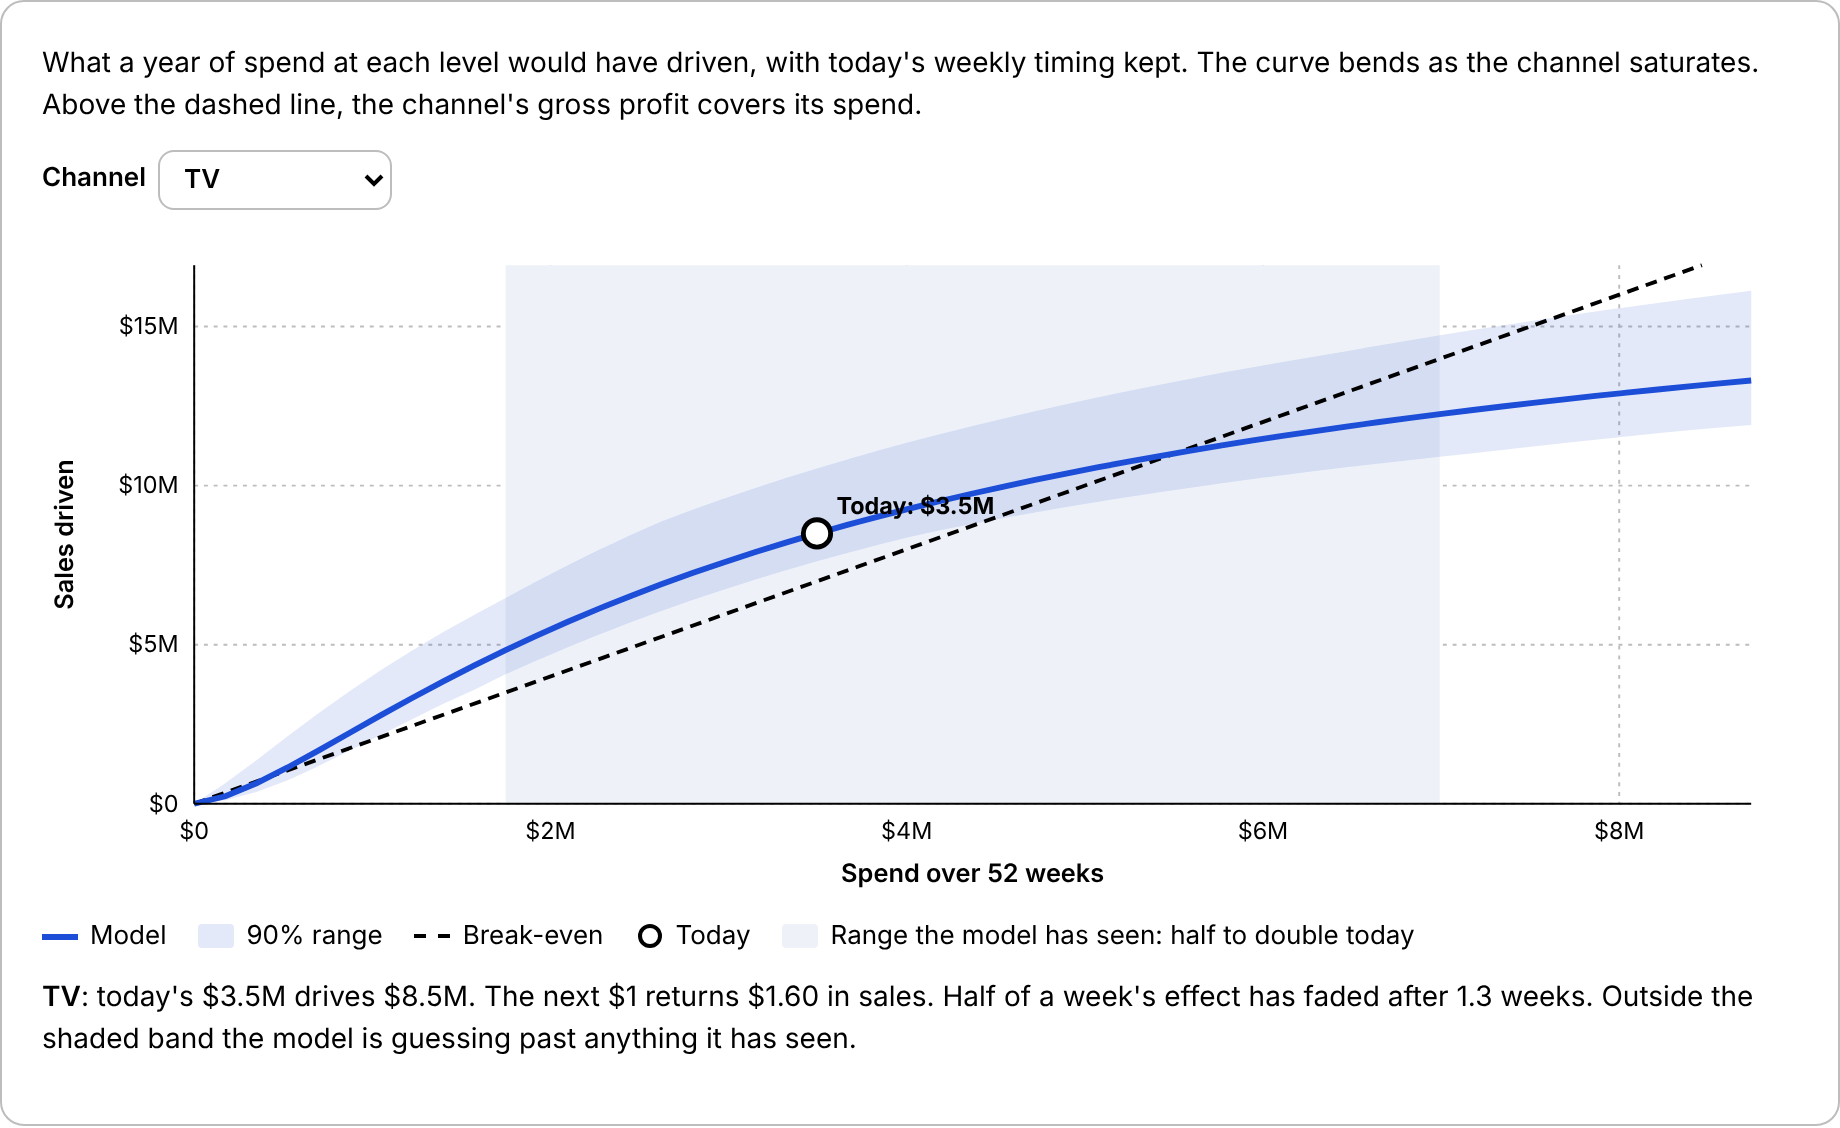
Sample data: The curve shows what each spending level delivers. If the curve is above the dashed line, the channel’s gross profit covers its spend.
Why does it ask for my role first?
The math stays the same for everyone, but the answer is tailored to your specific question.
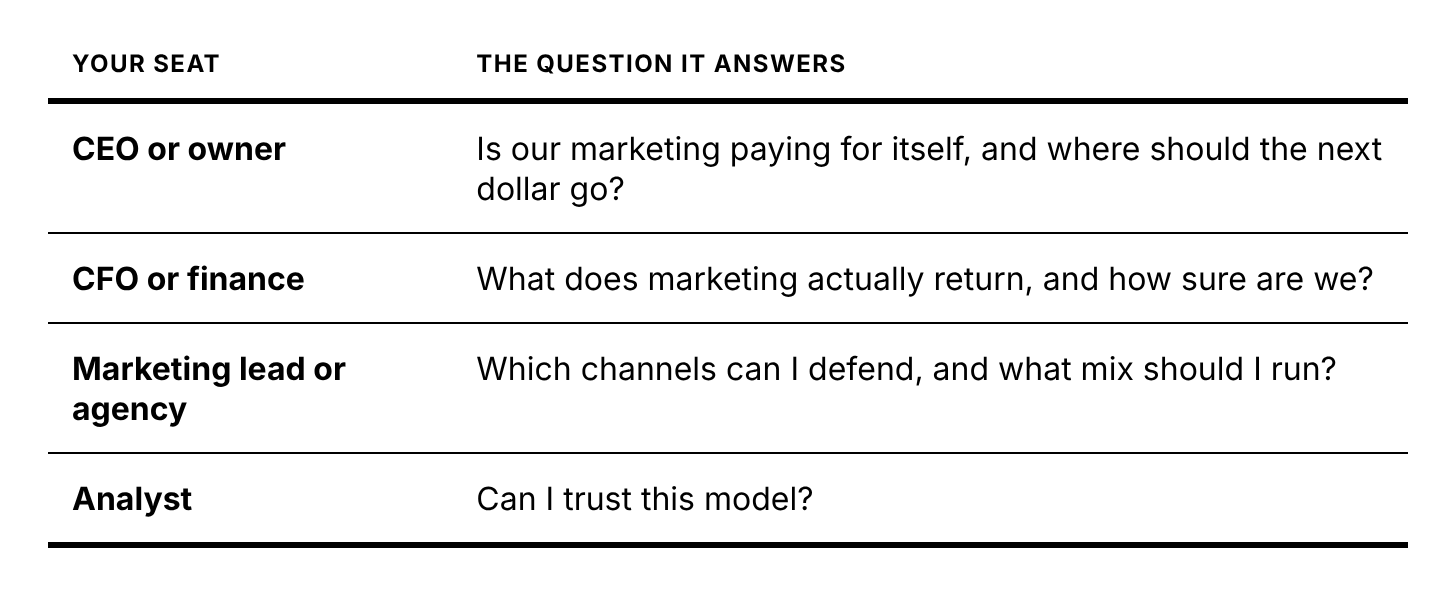
The CEO sees the payback line, budget changes, and the first test. The CFO gets gross profit per dollar, a list of channels below break-even with their ranges, and the held-back miss. Marketing gets the channels to defend, those at risk, and the new mix. The analyst gets the fit, data checks, and a ranked list of fixes.
How does it know when not to trust itself?
Held-back weeks: The last 13 weeks are never used in the fit. In the sample, the model missed them by less than 2%.
40 refits: If a verdict doesn’t hold in at least 80% of them, it never gets marked as Clear.
Overlap: If two channels’ spending moves together, the model can’t separate them. Both are sent to Test first.
Flat spend: If a channel’s spending stayed the same every week, it’s left out and named. The model can’t analyze what never changed.
Results posing as causes: Orders, leads, clicks, and impressions columns are left out. If you use a result as a driver, it absorbs the media effect.
If the model doesn’t fit—explaining less than 70% of weekly changes or missing more than 15% on held-back weeks—the readout stops. No verdicts, no plan.
How close does it get to the truth?
We built the sample with known answers so the tool can check the model against the truth.
Five out of six verdicts match the planted answer. The one miss: Paid social is Trim in reality, but Cut in the model. Both recommend spending less.
The true return falls within the model’s range for four out of six channels.
Radio is the biggest miss: $3.38 per $1 compared to a true $1.61. Radio is on the test list. If you add a simulated lift test result of $1.61, the model updates radio to $1.68.
That’s the point: a mix model finds patterns in past data, while a lift test proves what actually causes results.
What won’t it do?
Prove cause: If a lift test and the model disagree, trust the test.
Move budget: The model won’t shift budget on a channel it can’t settle. Channels marked Test first stay as they are.
Quote a result outside half to double today’s spend. The model has not seen it.
Measure a channel: The model can’t measure a channel if its spending never changed.
Read leads or orders: Convert these to dollars before using them in the model.
What do I need to run it?
A Claude account on any plan, with code execution turned on.
You’ll need one CSV file, with one row per week: include the week’s date, sales in dollars, and one spend column for each channel.
You need at least 52 weeks of data, but 104 or more helps separate seasonal effects from trends.
Make sure your spending changed over time. Each channel should have at least 8 weeks with spending.
You’ll also need your gross margin.
Optional: You can also include price, promotions, events, economic data, and any lift test results.
No connectors or MCP servers are needed. Your files stay within your Claude session.
How was it tested?
There are five test files: one clean file with almost no noise, and a messy export with a dozen planted problems like text numbers, duplicate weeks, blank or negative spend, and bad dates. There’s also one file that’s too short, one monthly, and one daily—each must stop or roll up correctly.
On the clean file, the median error for each channel’s planted return is under 3%, and it gets all six verdicts right. Every count on the messy file matched an answer key based on how the file was made: 39 checks, all passed.
How do I get it?
Download the skill from GitHub.
In Claude, go to Customize, then Skills, click the plus sign, choose Create skill, and upload your skill.
Upload your weekly file and say: “What does each channel actually drive? I’m the CFO. Our gross margin is 45%.” Replace with your own role and margin as needed.
No data handy? Just say, “Run the marketing mix model demo.” Claude will build a sample brand and show the model compared to the planted truth.
The code, sample data, and tests are all public on GitHub: github.com/bbecht/demand-gen-claude-skills. Read every line before you run it.
Until next month, keep your CRM honest,
Bill
Marketing Systems Guild. Turning strangers into clients.